4 Charts to Watch Next Week

Ameet Rai
Electrical Engineer and Swing Trader focused on achieving super-performance. Through extensive studies of previous super-performance stocks and proprietary data-based research I provide guidance for new traders with an emphasis on building processes and teaching traders how to think and trade for themselves.
Published: July 28, 2024


Written by: Ameet Rai
Never miss a post from Rai!
Sign up to get instant notifications when I publish a new post.
SPY – The S&P 500 is near its 50 Day SMA with the 21 DMA now sloping down with the 10 Day SMA. The longer we stay below of near the 50 Day the higher the chances that volatility increases and eventually all stocks get clobbered.

IWM – a clear rotation process is underway in the markets with the Russell now seeing a multiyear breakout on the weekly and consolidating above the 10 Day SMA on the Daily. This is key to keep track of as discussed many weeks ago in a live stream.

QQQ – The Q’s are firmly below the 50 Day SMA with the 21 Day SMA about to cross below the 50 Day. Watching for a test of the 50 Day next week to see how we close when the day we test the 50 Day SMA.

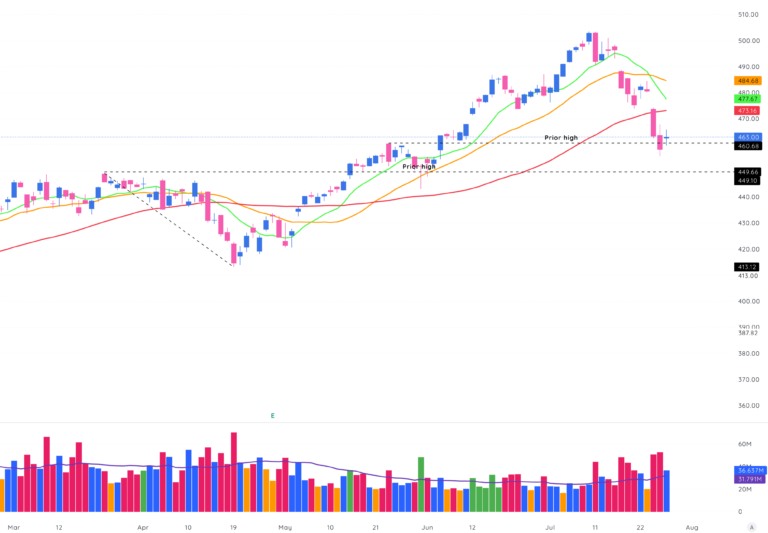
COUR – Coursera up 51% on Friday and registered an HVE (Highest Volume Ever). Stock gapped up on beating estimates driven by AI demand.

Related articles
-

-

-

How to Bottom Fish Stocks Without Getting Burned
September 10, 20246 min read -