The Wedge Drop
Master the critical signal that confirms the end of an uptrend and learn how to preserve profits or capitalize on the downtrend
The Wedge Drop is a critical signal in the Cycle of Price that confirms the end of an uptrend and the need to exit or short a position. Following an Exhaustion Extension, when the price drops below key moving averages and fails to recover, it’s time to recognize that the uptrend has concluded. In this lesson, you’ll learn how to spot the Wedge Drop, understand its significance, and take the necessary actions to preserve profits or profit from the downtrend.
Learning Objectives
By the end of this lesson, you will be able to:
- Identify the Wedge Drop as a signal that an uptrend has ended
- Recognize the key signs of market deterioration leading to a Wedge Drop
- Understand how to manage risk by exiting or shorting a stock during a Wedge Drop
- Use the Wedge Drop to assess broader market conditions and individual stock strength
- Apply the Wedge Drop to both individual stocks and indices to refine your trading strategy
What is a Wedge Drop?

Defining the Wedge Drop
The Wedge Drop occurs when the price of a stock or market index trades below its moving averages (typically the 10- and 20-day EMAs) following a period of consolidation after an Exhaustion Extension. This drop confirms that the uptrend has ended, and the stock is likely to enter a longer consolidation phase or a new downtrend.
Key Indicators
- Loss of Moving Average Support: The moving averages, which previously supported the price during the uptrend, now act as resistance, guiding the stock lower
- Confirmation of a Top: The Wedge Drop confirms that the stock has likely reached an intermediate-term or long-term top
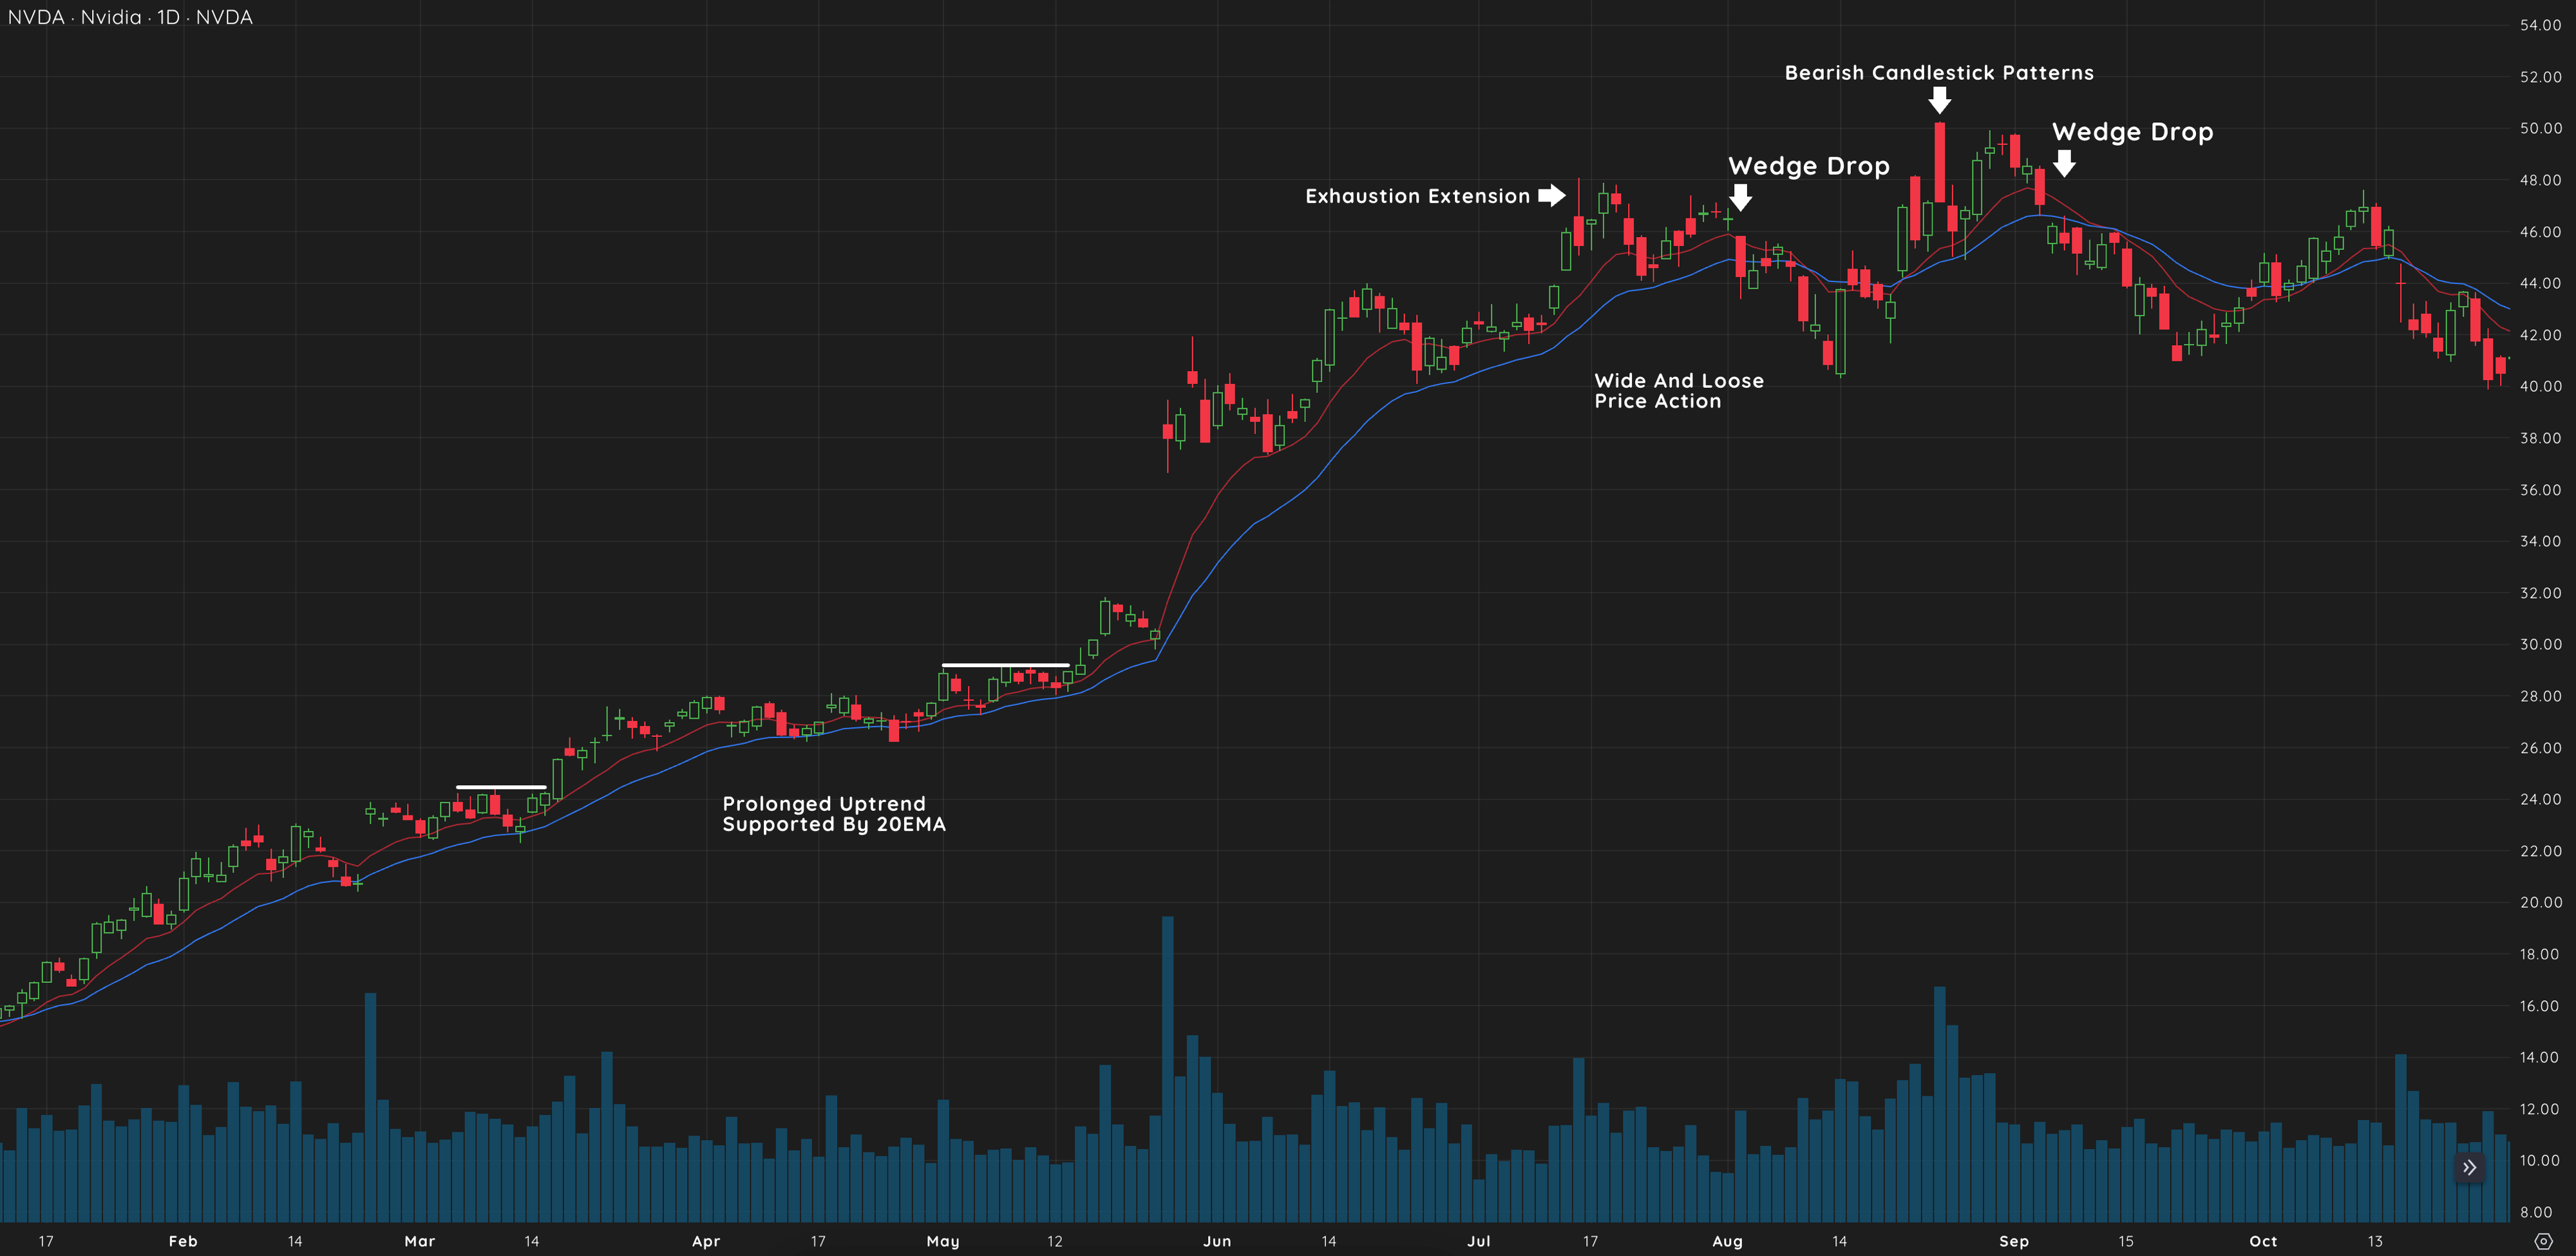
Example: NVDA 2023
In 2023, NVDA experienced multiple Exhaustion Extensions before eventually breaking below its moving averages in a Wedge Drop, confirming the end of the uptrend and signaling the need for a new base to develop.

Key Characteristics of a Wedge Drop
- Tight Range Consolidation: After an Exhaustion Extension, the price consolidates in a tight range, allowing the moving averages to catch up
- Break Below Moving Averages: When the price breaks below the moving averages with increased selling pressure, the Wedge Drop is confirmed
- Increased Selling Volume: As the price drops, you’ll often see a spike in distribution volume, signaling that sellers are taking control
Recognizing the Signs of a Topping Formation
Signs Leading to a Wedge Drop
The Wedge Drop doesn’t happen in isolation. There are key signs that the stock is losing momentum and that a top may be forming:
- Bearish Reversal Candlestick Patterns: Watch for patterns like the shooting star or bearish engulfing that signal a potential reversal
- Increased Distribution Volume: A rise in selling volume, particularly on down days, indicates that sellers are overwhelming buyers
- Decreased Accumulation Volume: If buying volume dries up, it’s a sign that the uptrend is losing steam
- Slowing Rate of Change: When the stock struggles to make higher highs despite taking out previous highs, it signals a loss of momentum
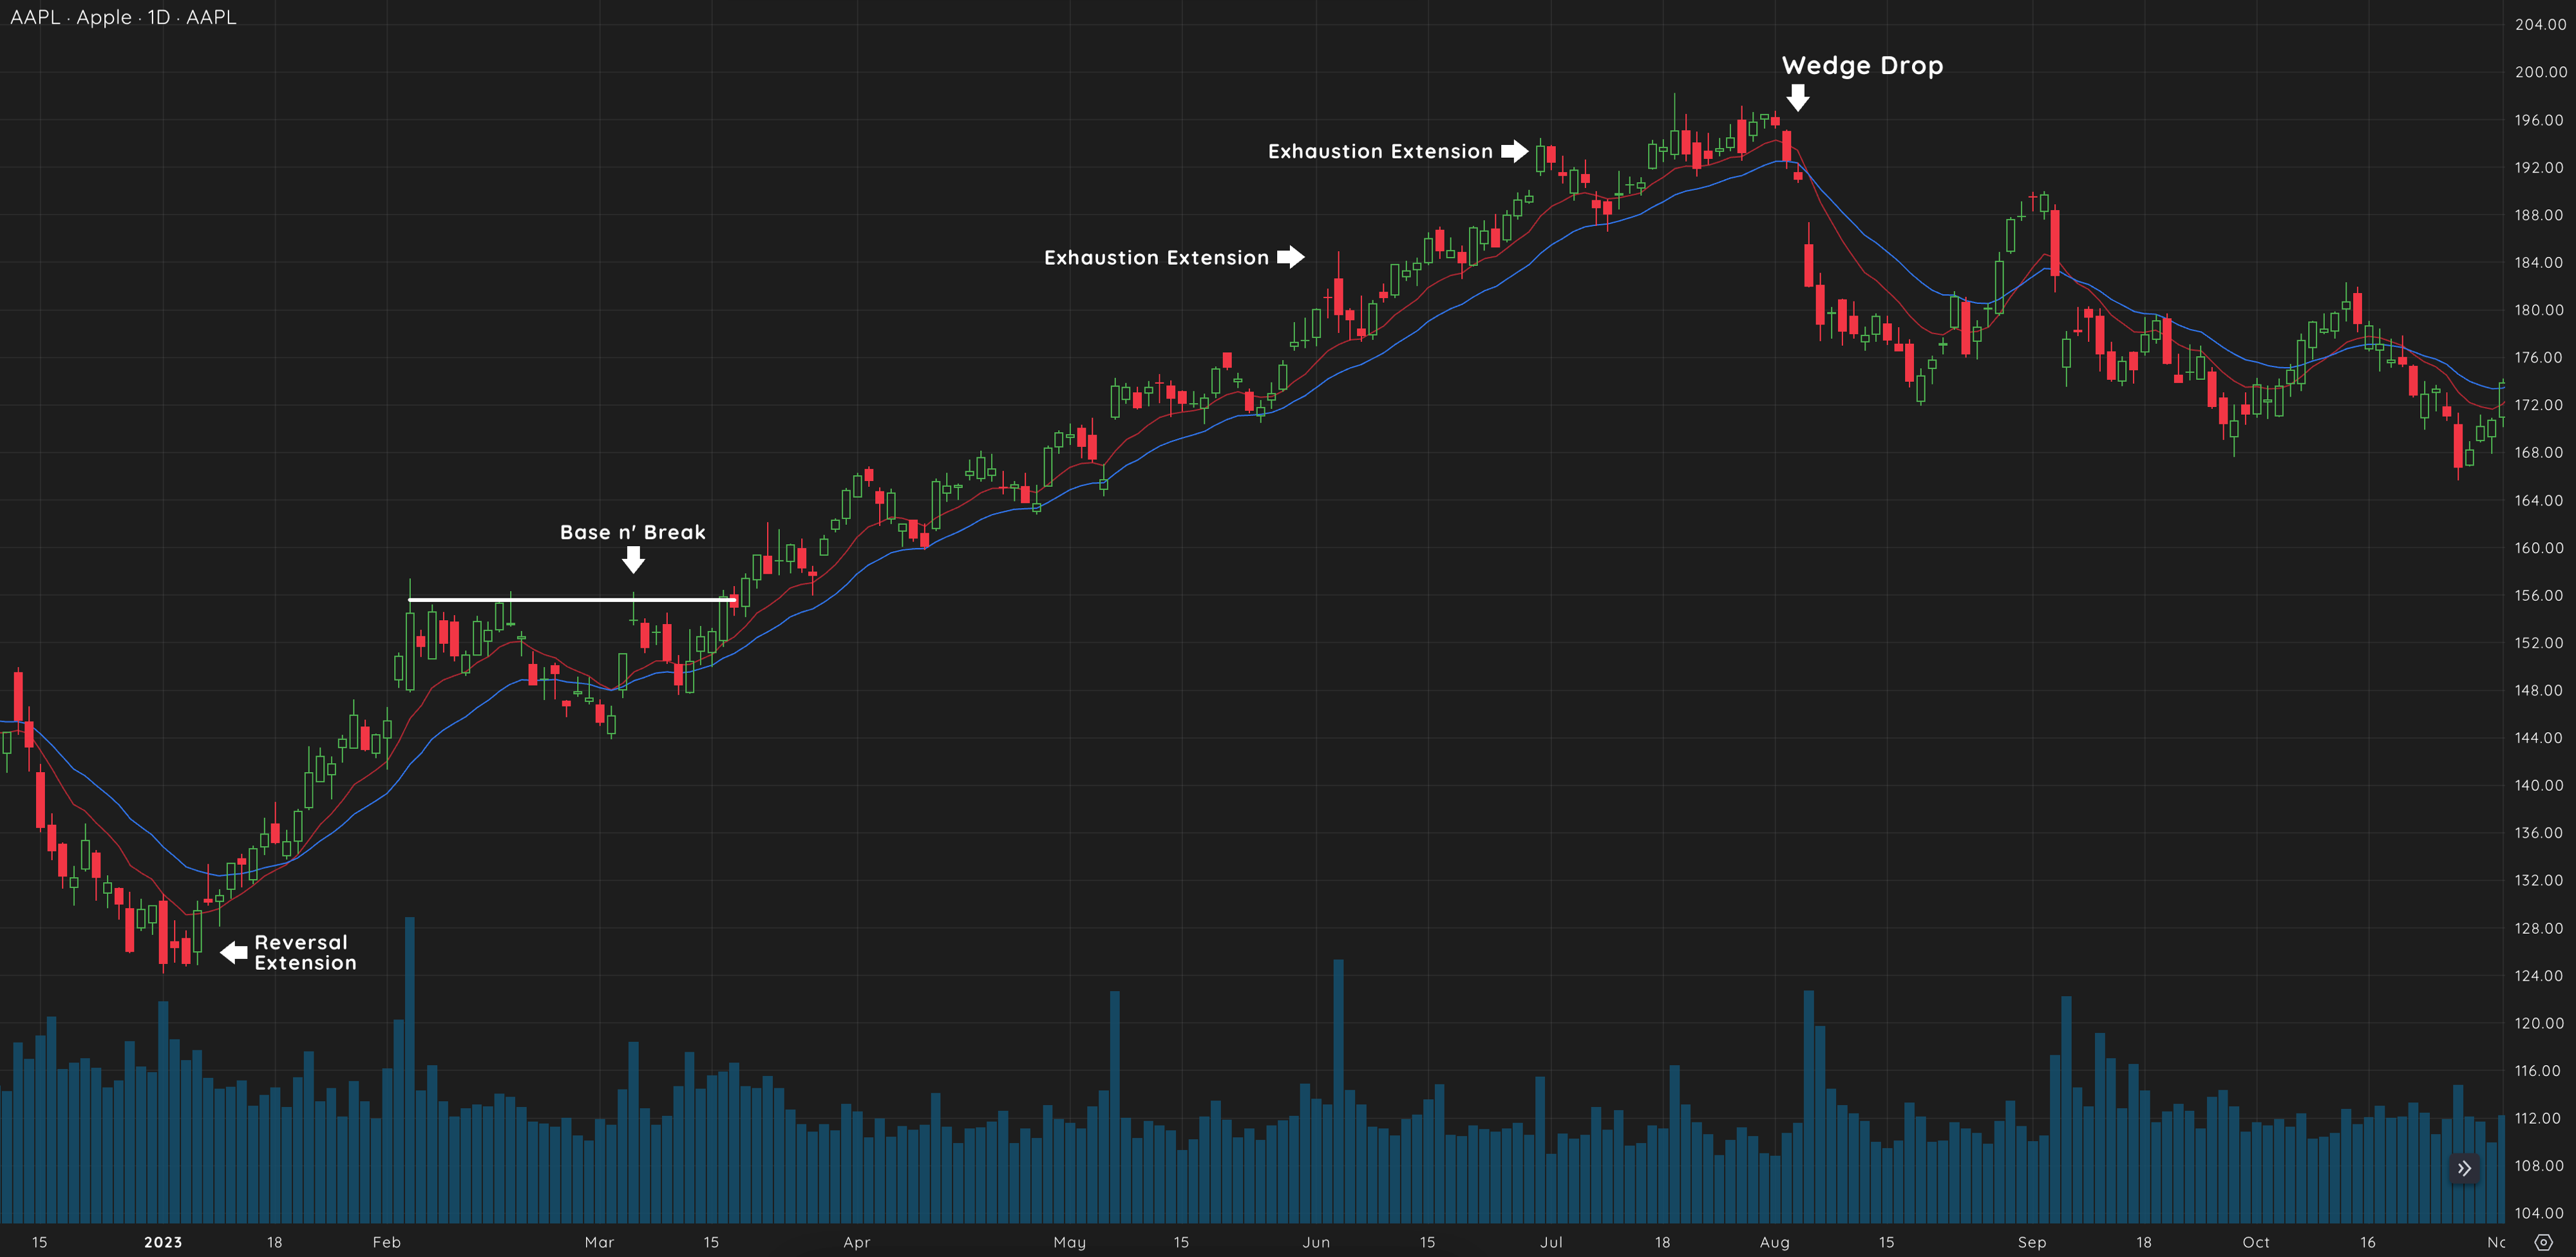
Example: AAPL 2023
In 2023, AAPL exhibited multiple signs of topping, including bearish candlesticks and declining accumulation volume, before eventually experiencing a Wedge Drop that confirmed the end of its uptrend.

Situations Without an Exhaustion Extension
In some cases, there may not be a clear Exhaustion Extension before a Wedge Drop. Instead, the stock may trade sideways in a tight consolidation and lose momentum, eventually rolling over into a Wedge Drop. This underscores the importance of monitoring for any signs of relative weakness.
Trading the Wedge Drop: Exiting or Going Short
Exiting a Long Position
The Wedge Drop provides a clear signal to exit your long position and lock in profits before the stock enters a consolidation or downtrend.
- Exit When the Price Breaks Below the Moving Averages: As soon as the price drops below the 10- and 20-day EMAs, it’s time to exit. The moving averages, which previously acted as support, will now act as resistance, preventing the stock from making higher highs
Shorting the Wedge Drop
Just as the Wedge Pop provides a low-risk entry for an uptrend, the Wedge Drop offers a low-risk entry for a short position:
- Short at the Pivot: When the price breaks below the moving averages and through a tight range, it sets up a pivot point. Short the stock at this point, with a stop placed just above the high of the consolidation range or the current day’s high
- Be Cautious of Volatility: Downtrends can be more volatile than uptrends. If the stock reclaims the moving averages, exit your short position to avoid being caught in a reversal
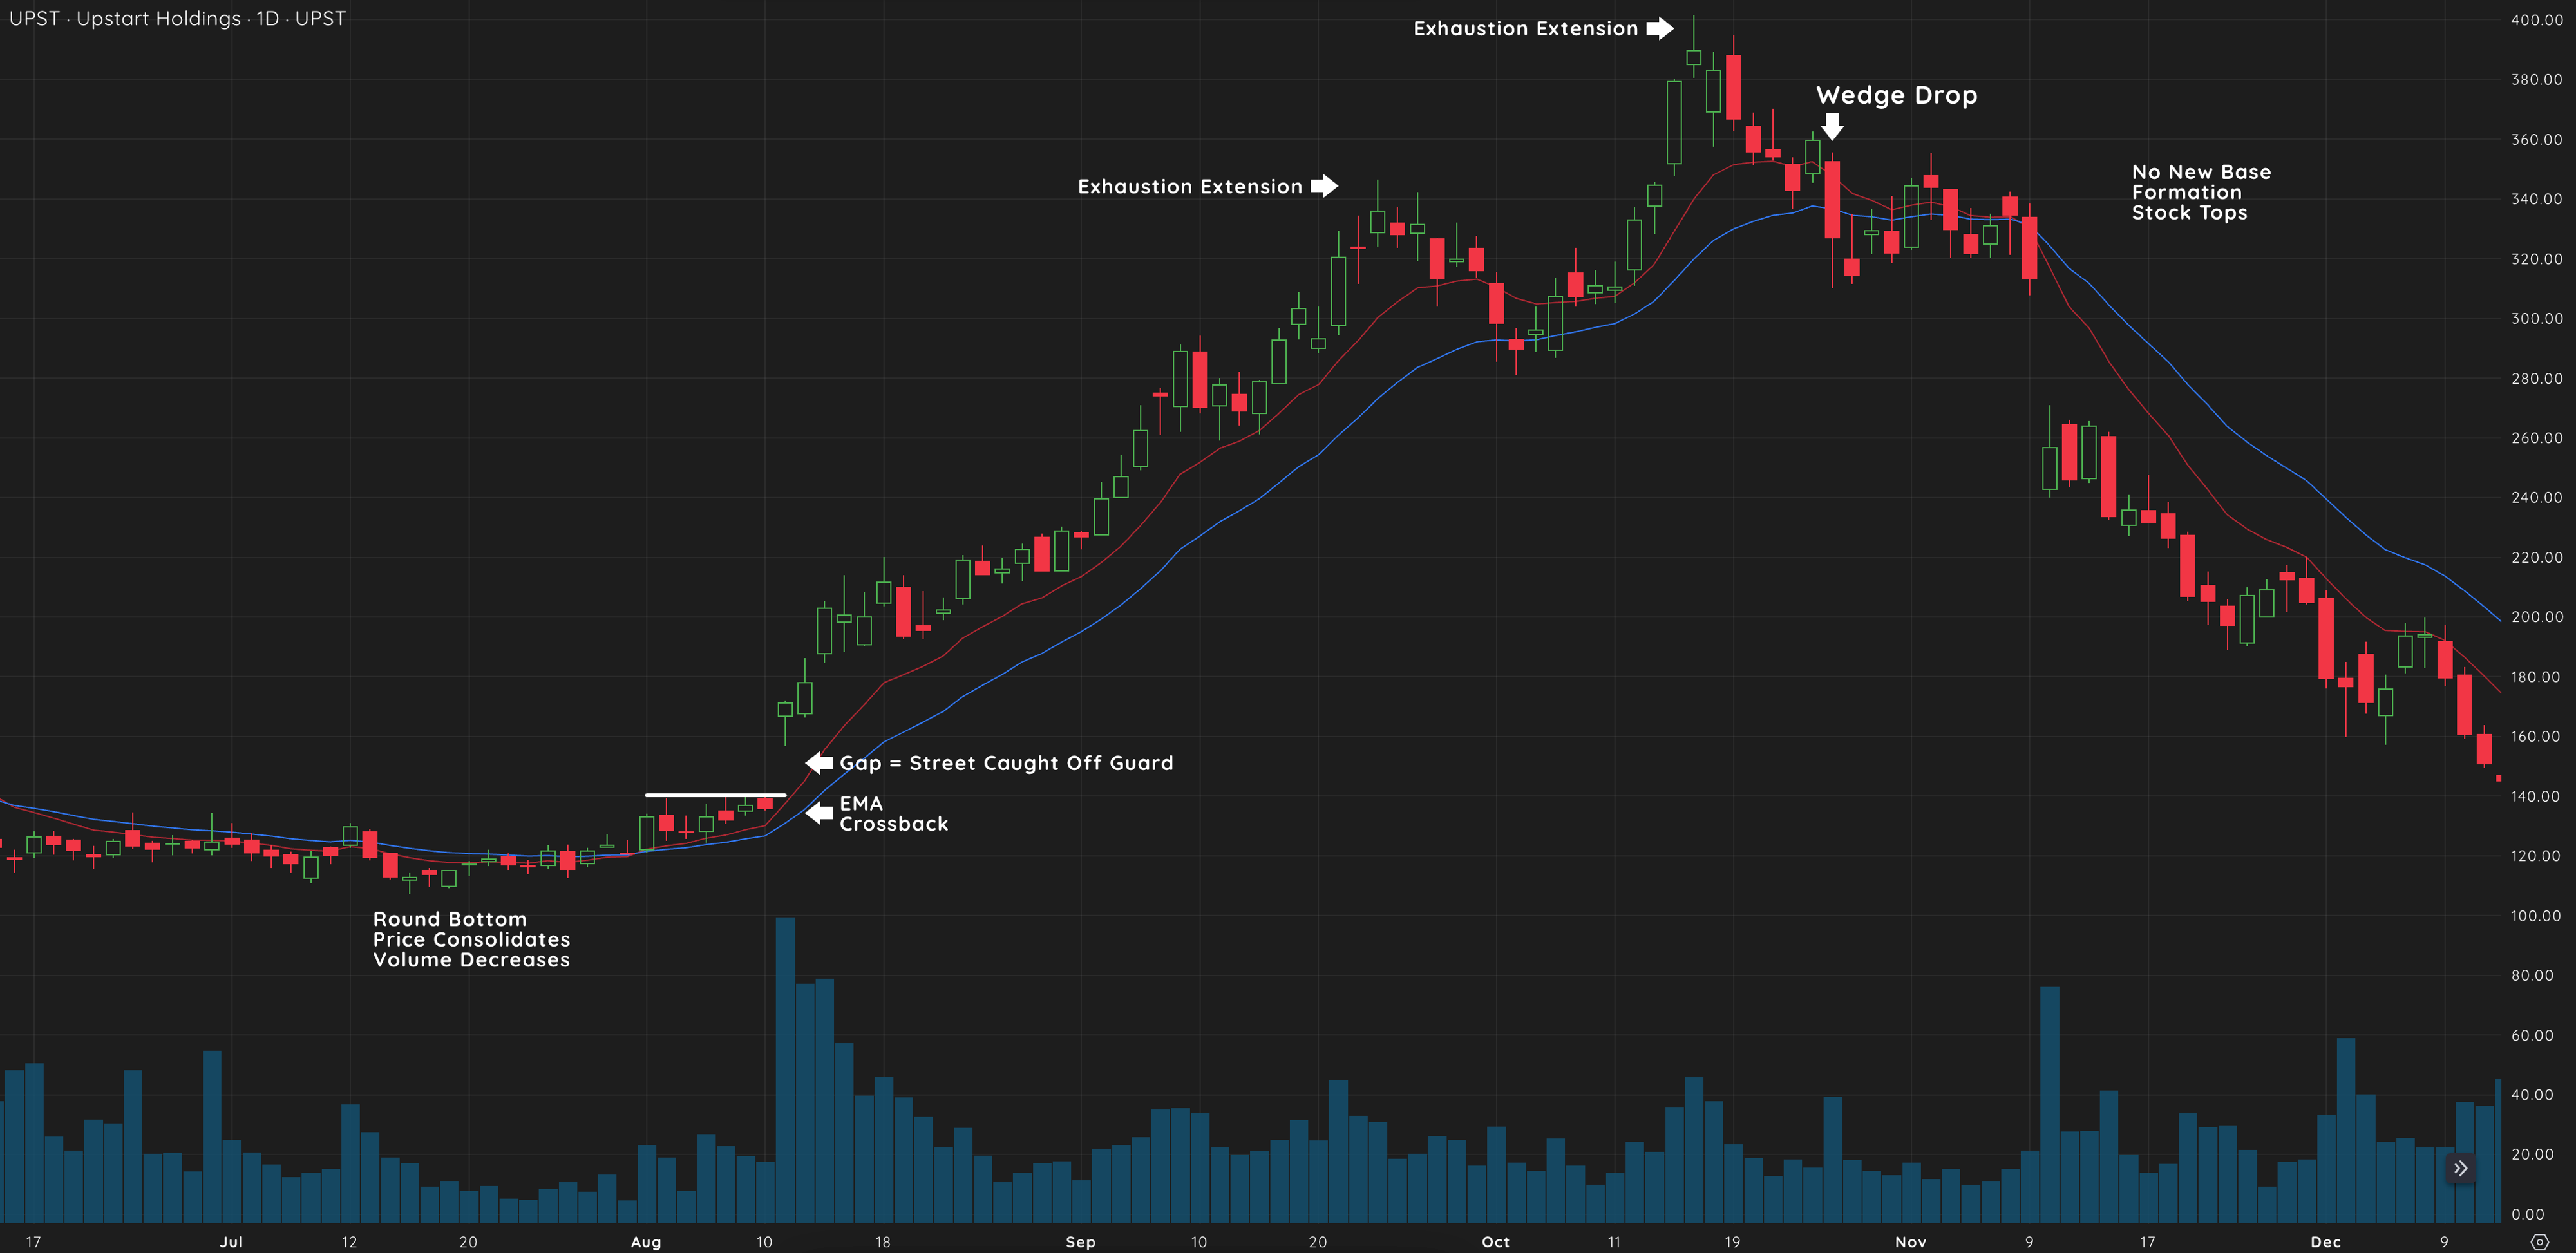
Example: UPST 2021
In 2021, UPST formed a clear Wedge Drop after an extended uptrend. Traders who shorted the stock at the pivot point were able to capitalize on the subsequent decline as the stock entered a downtrend.

Applying the Wedge Drop to Indices and Market Conditions
Leading Stocks vs. Indices
Just as leading stocks often begin their Cycle of Price ahead of the broader market, they can also show signs of weakness before the indices. Keep an eye on leading stocks, as their behavior can be a strong indicator of where the overall market is headed.
- Market Breadth Indicators: When multiple leading stocks begin to experience Wedge Drops, it’s a sign that market breadth is weakening. This often signals that the broader market may be on the verge of a correction
- Monitor Index Wedge Drops: If you see a Wedge Drop forming on a major index like the S&P 500 or NASDAQ, it’s time to get defensive and reduce your exposure to long positions. Bullish chart patterns and breakouts are more likely to fail when the market as a whole is weakening
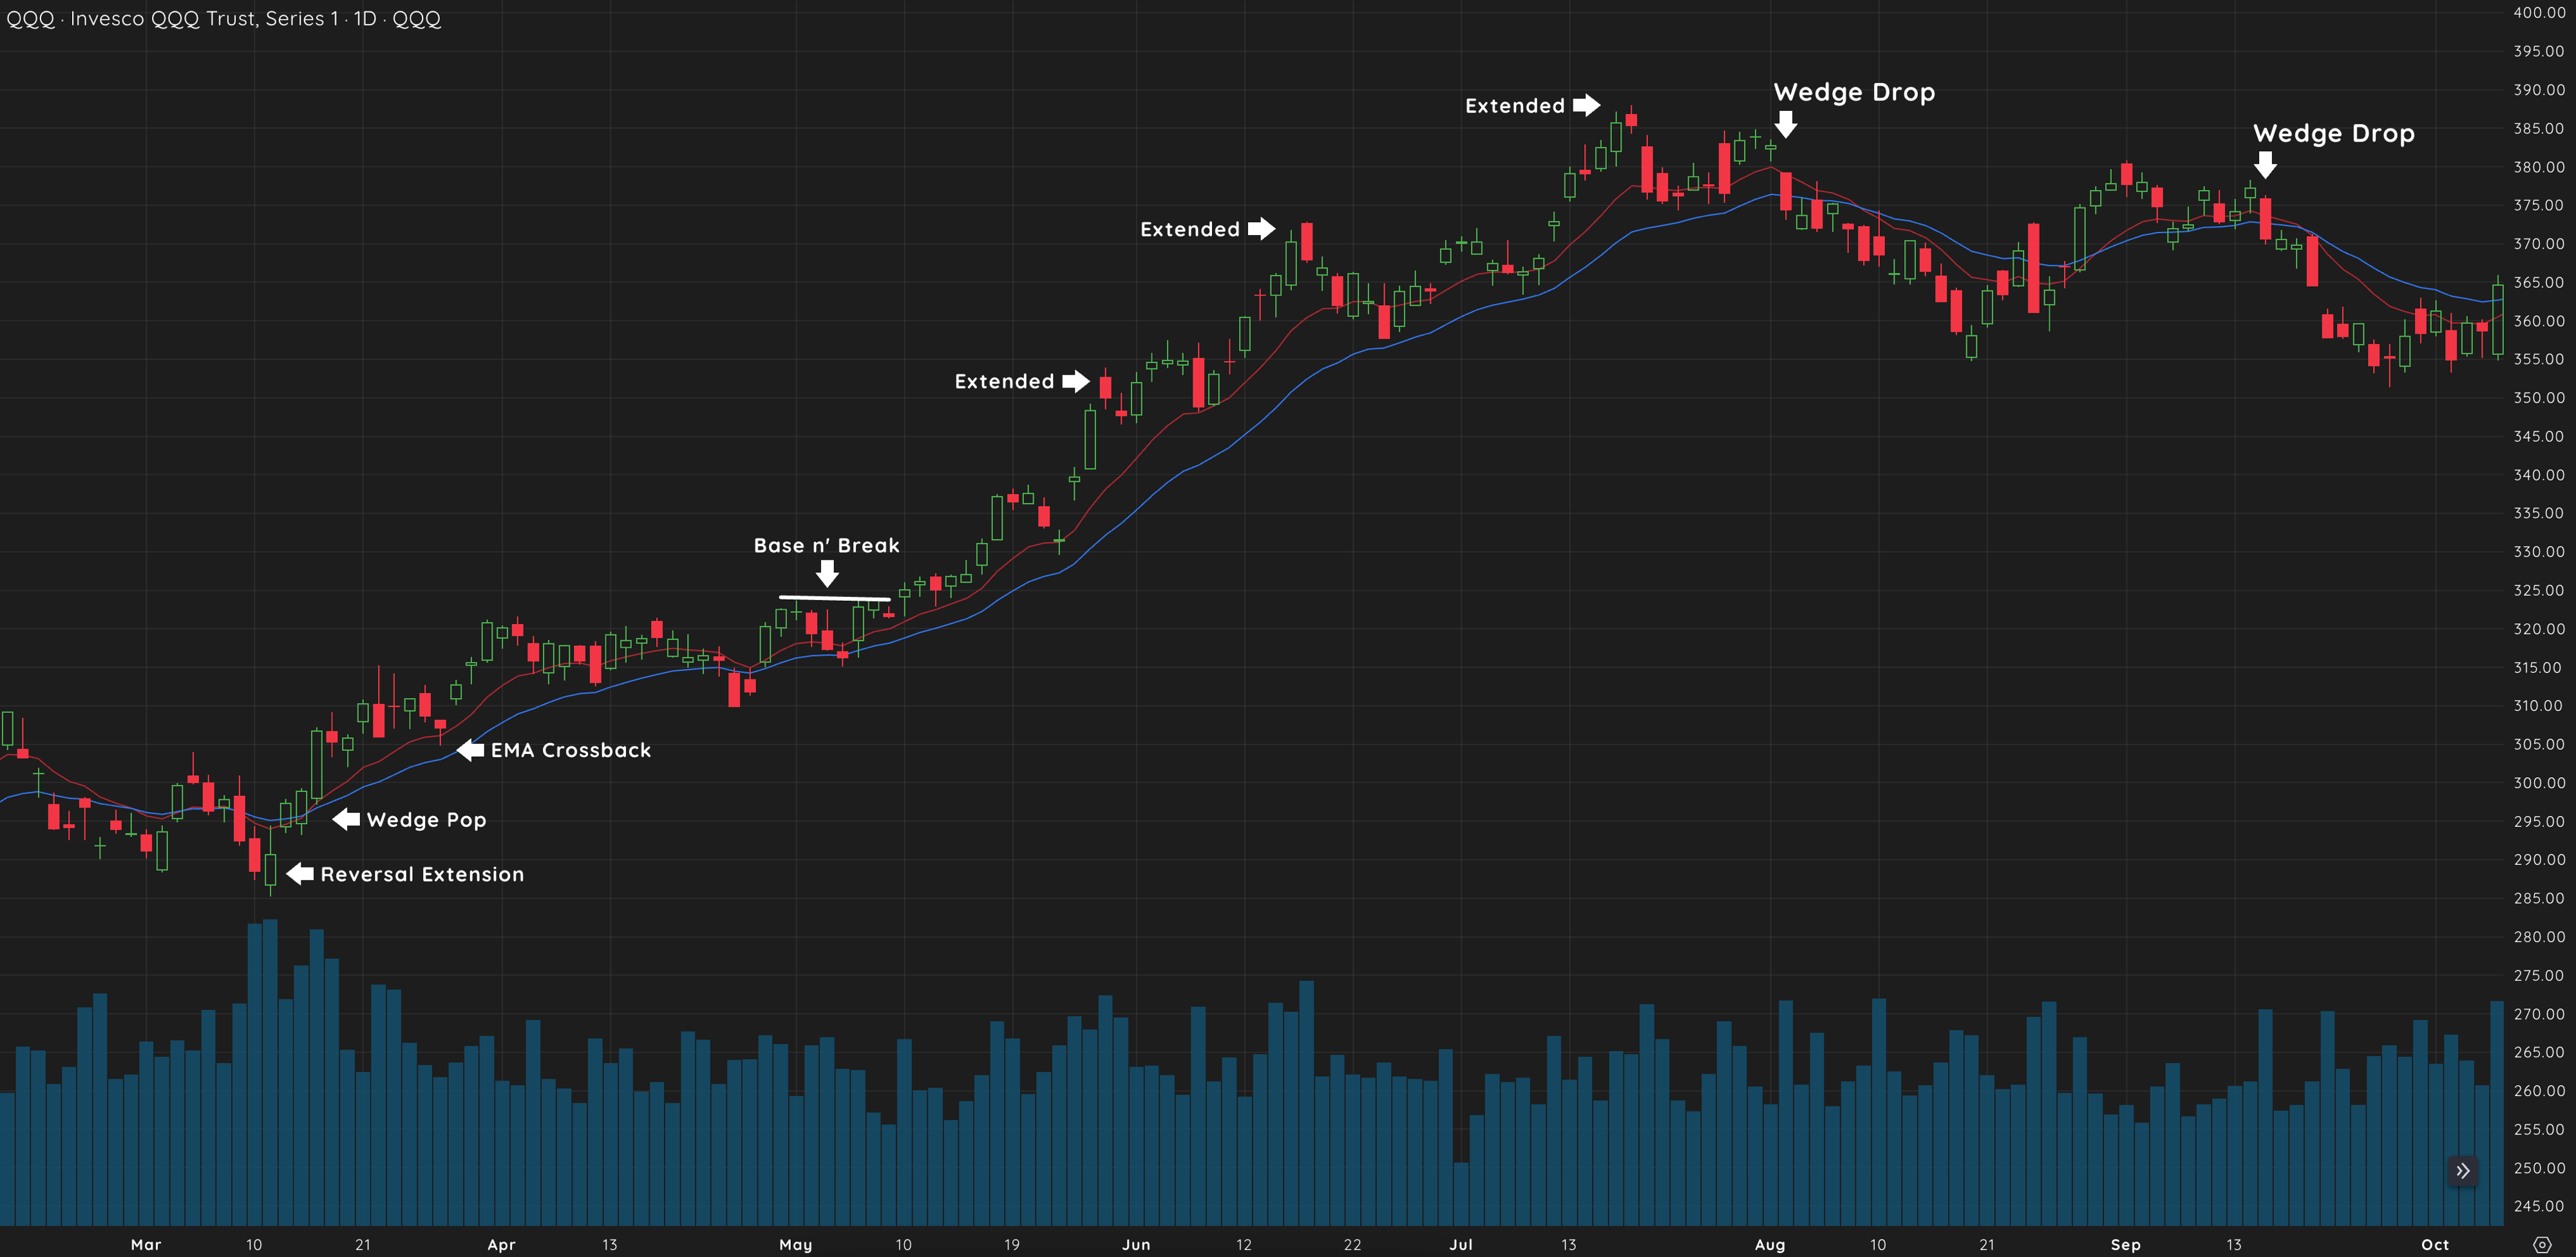
Example: QQQ 2023
In 2023, the QQQ index formed a Wedge Drop after an extended rally, signaling that the broader market needed to consolidate. Traders who reduced their exposure avoided significant losses as the market corrected.

Screening for Relative Strength
After a Wedge Drop, the market often takes time to rebuild. Use this period to screen for stocks showing relative strength—those that are holding up better than the broader market and maintaining support near their moving averages.
Reflection
Think about how you can apply the cycle of price action to your current trades. Where do you need to improve your timing or stock selection?
Conclusion
The Wedge Drop is a powerful signal that marks the end of an uptrend and provides clear guidance for managing risk. By recognizing the signs of a topping formation and understanding when to exit long positions or enter short positions, you can preserve capital and even profit from market declines. Remember that market cycles are natural, and the Wedge Drop is simply one phase in the ongoing Cycle of Price. Stay patient in the early stages of a stock’s cycle and become more defensive as it approaches exhaustion. With these tools, you’ll minimize losses and maximize profits as you navigate the stock market.
