You’ve learned the system. You know when to enter, when to exit, and how to size positions through each cycle phase.
But here’s the question: how long do these cycles actually last?
We’ve been saying “around 20 days” throughout the course. Let’s look at where that number comes from — and more importantly, why it changes based on market conditions.
The QQQ Data: 12 Years of Up Cycles
We analyzed every QQQ up cycle from 2012 to 2024. To reduce noise, we only looked at cycles longer than 4 days (the really short ones are usually just whipsaws).
Here’s what the data shows:
Average up cycle length: 21 days
But this number alone is misleading. Context matters.
Market Character Changes Everything
When you break down the data by market environment, you get a different picture:
Bull Market Years (2017, 2019, 2020, 2023)
Average cycle length: 29-34 days
These were years where the market was in a sustained uptrend. Cycles ran longer because buying pressure was strong and consistent.
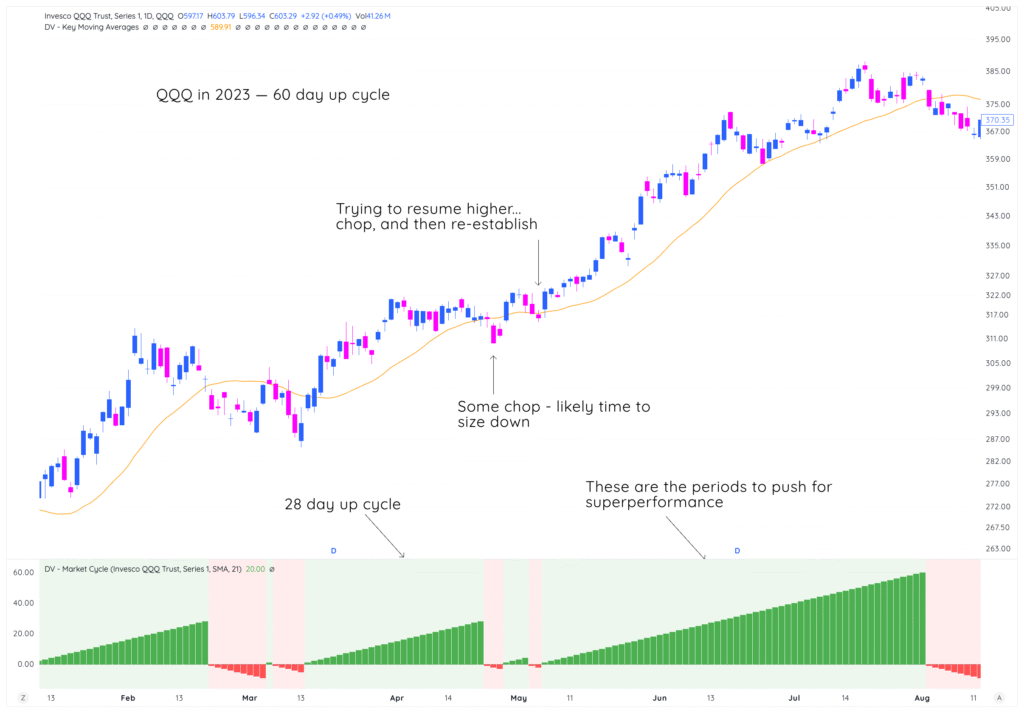
2023 examples:
- 60-day cycle (exceptional)
- 41-day cycle
- 28-day cycle (twice)
In bull markets, Days 20-25 are still healthy. The environment supports extended runs.
Bear/Choppy Years (2015, 2018, 2022)
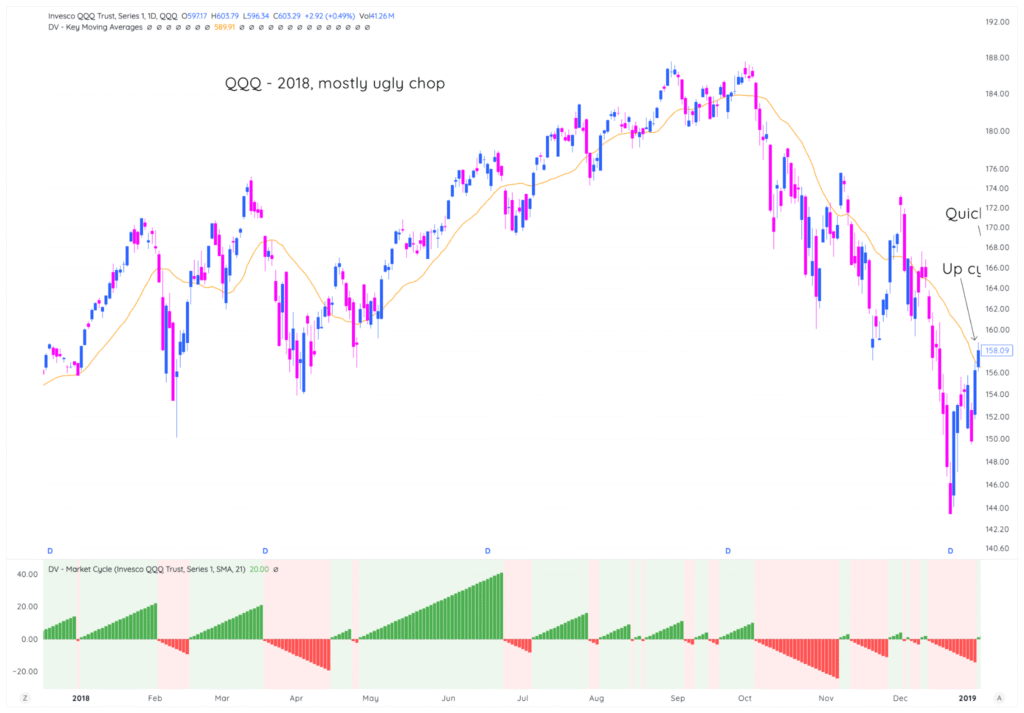
Average cycle length: 13-15 days
These were years of distribution, correction, or constant chop. Cycles failed faster because there wasn’t sustained buying interest.
2022 examples:
- 9, 17, 8, 33, 8, 17 days
- Mostly short failures with one outlier
In bear markets, Day 15 is already late cycle. You need to be much more aggressive with profit-taking.
Normal Years (2012-2014, 2021, 2024)
Average cycle length: 20-21 days
These were years without extreme bull or bear characteristics. The market moved in typical intermediate waves.
2024 examples:
- 29, 16, 9, 50, 14, 29, 5, 7, 21 days
- Mix of short and medium cycles with one extended outlier
This is your baseline expectation. Use 20 days as default unless you’re clearly in a bull or bear environment.
What This Means for Your Trading
Plan for 20 days, but adapt based on market character.
In bull markets:
- Be more patient with winners
- Can hold through Days 20-30 if cycle is strong
- Add to positions more aggressively post-stress test
- Only get defensive when you see clear breakdown signals
In bear markets:
- Start reducing by Days 12-15
- Take profits faster (don’t wait for 20%+ gains)
- Use smaller initial position sizes
- Expect cycles to fail quickly
In normal markets:
- Use the 20-day guideline as written in this course
- Start getting cautious around Day 15-18
- Let individual stock action guide you
The Outliers: Long Cycles Do Happen
Looking at the data, you’ll see cycles that ran 40, 50, even 60+ days. These are rare but they happen, usually during:
- Strong bull markets with clear leadership
- Post-crash recoveries with massive short covering
- Major technological shifts (like AI in 2023)
Don’t fight these extended cycles if you’re in them. Let your stocks tell you when to exit through their technical action, not just the calendar.
Historical Case Studies: How The System Performed
Now let’s look at three critical periods in market history to see how the Market Cycle System would have guided you through extreme conditions.
Case Study 1: SPX in 1997 (Bull Market)
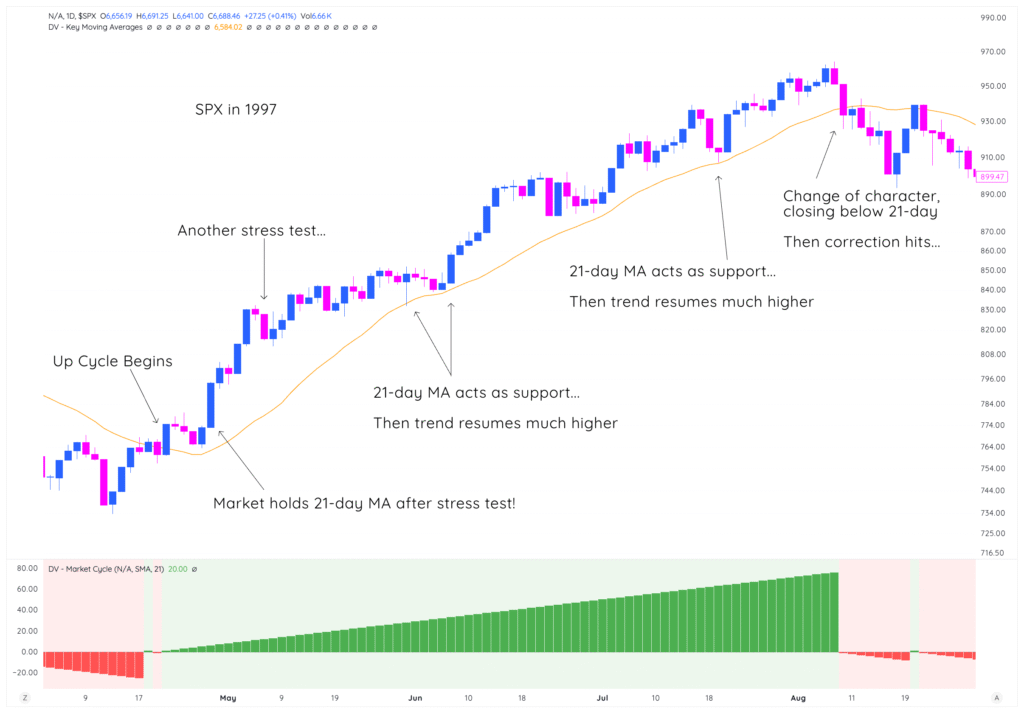
What you’re seeing:
- Up cycle begins and immediately gains traction
- 21-day MA acts as support repeatedly through stress tests
- Market holds the MA, trend resumes higher (happens multiple times)
- Another stress test — again, 21-day MA provides support
- Pattern continues for months with extended cycles
- Eventually: Change of character, closing below 21-day
- Then correction hits
The lesson: In strong bull markets, the 21-day MA is your friend. Stress tests hold, cycles run 40-80+ days, and the system keeps you positioned for massive gains. Only exit when the technical signal breaks.
This was a period where cycle lengths averaged 30+ days. Being patient and holding through multiple stress tests was the winning strategy.
Case Study 2: SPX in 2001 (Bear Market)
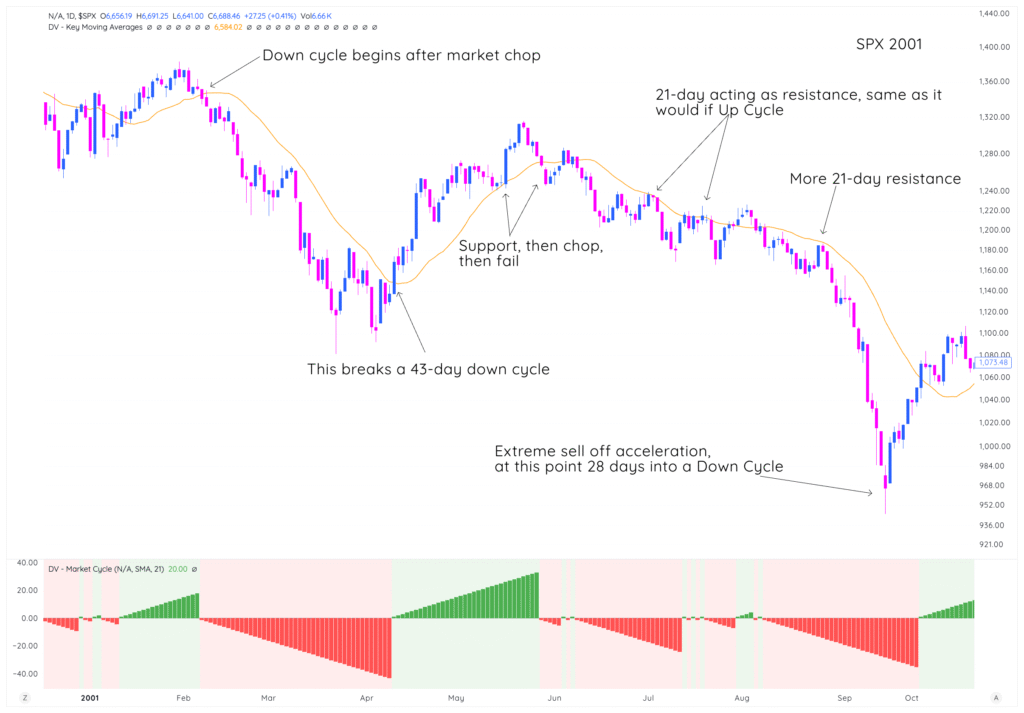
Complete opposite of 1997.
What you’re seeing:
- Down cycle begins after market chop
- 21-day acting as resistance (not support)
- Brief rally: “Support, then chop, then fail”
- Breaks a 43-day down cycle — but just leads to more distribution
- More 21-day resistance on the next rally attempt
- Extreme sell-off acceleration 28 days into a down cycle
The lesson: In bear markets, the 21-day MA becomes resistance. Up cycles are short-lived relief rallies (often 5-15 days) that fail quickly. Down cycles extend for 30-50+ days.
This is when you want to be in cash or short. Most rallies are a selling opportunity, not a buying opportunity.
The contrast between 1997 and 2001 is pretty clear:
- 1997: 21-day MA = support, cycles run long, stress tests hold
- 2001: 21-day MA = resistance, up cycles fail fast, down cycles extend
Case Study 3: SPX in 2007-2008 (Distribution into Crisis)
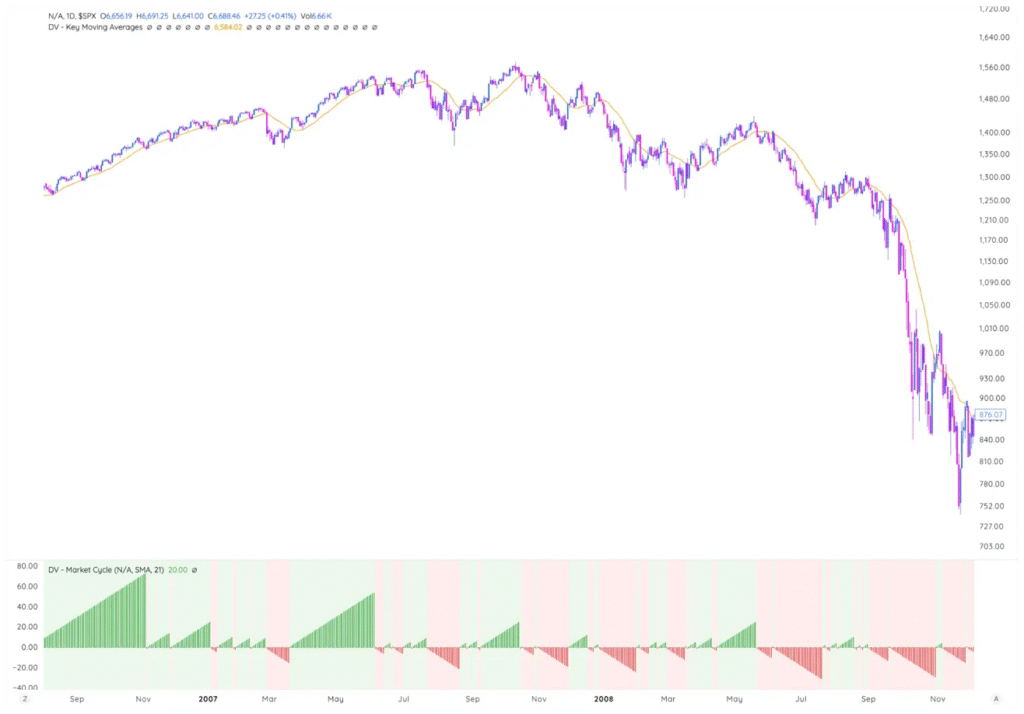
We’re leaving this one without annotations. Take a minute and look at it yourself.
Questions to consider:
- Can you identify where the cycle character changed?
- When did up cycles start getting shorter?
- Where would the Market Cycle System have gotten you defensive?
- At what point was it obvious this wasn’t a normal correction?
Look at the cycle indicator at the bottom:
- 2007 (left side): Long extended green bars — classic bull market
- Mid-2007: Cycles start getting shorter, more chop
- 2008: Increasing red (down cycles), shorter green relief rallies
- Late 2008: Almost entirely red with catastrophic drop
The lesson: Market cycles getting progressively shorter is a major warning sign. When you go from 40-60 day cycles to 15-20 day cycles to 5-10 day cycles, the market is telling you something is breaking.
The system would have gotten you defensive well before the worst of the crash by simply following the cycle signals.
Bringing It All Together
Here’s what 12 years of data and three major historical periods teach us:
Average cycle = 21 days, but adapt to conditions:
- Bull markets: 30+ days
- Bear markets: 13-15 days
- Normal markets: 20-21 days
The 21-day SMA changes roles:
- Bull markets: Acts as support through stress tests
- Bear markets: Acts as resistance on relief rallies
- This tells you everything about position management
Cycle length shortening = warning sign:
- When cycles that were running 30-40 days start failing at 15-20 days
- When cycles that were running 20 days start failing at 10 days
- This precedes major corrections
Use the data as a guideline, not a rigid rule:
- Don’t automatically sell on Day 20 if everything is working
- Don’t hold to Day 20 in a bear market hoping it turns
- Let cycle behavior and individual stock action guide you
Key Takeaways
- Average QQQ up cycle: 21 days (based on 12 years of data)
- Bull markets run 30-34 days on average
- Bear markets run 13-15 days on average
- The 21-day SMA acts as support in bulls, resistance in bears
- Shortening cycle lengths warn of deteriorating conditions
- Historical examples prove the system works across all environments
Looking Forward
You now have the complete Market Cycle System:
- How to identify cycles (21-day SMA)
- How to read cycle phases (Days 1-3, 4-7, 8-15, 15+)
- How to enter and exit (early positioning, stress test management)
- How to size positions (progressive exposure)
- How long cycles last (21 days average, varies by environment)
Next lesson: Putting it all together. We’ll create your complete system checklist and give you the next steps to start implementing this in your own trading.