You know which cycle phase you’re in.
Now the question is: how can you leverage the Market Cycle System to help you enter and exit your trades?
We’ve hinted at this already, but most traders wait too long for “confirmation” and miss the explosive early moves. Or they hold too long into late cycle and give back all their gains.
Today’s lesson will help you solve both of those problems, and give you a couple of actionable examples so you can start to find these patterns yourself in the stocks you trade.
Trading Bigger Early in the Cycle (Days 1-3)
Here’s what most traders do: they wait for confirmation. Three, four, five days of upward movement before they finally feel comfortable buying — and by then, we’re likely headed for a pullback, and you’ve missed a ton of gains just because you weren’t comfortable trading a new up cycle signal.
Let’s take this Tesla example from early 2025:
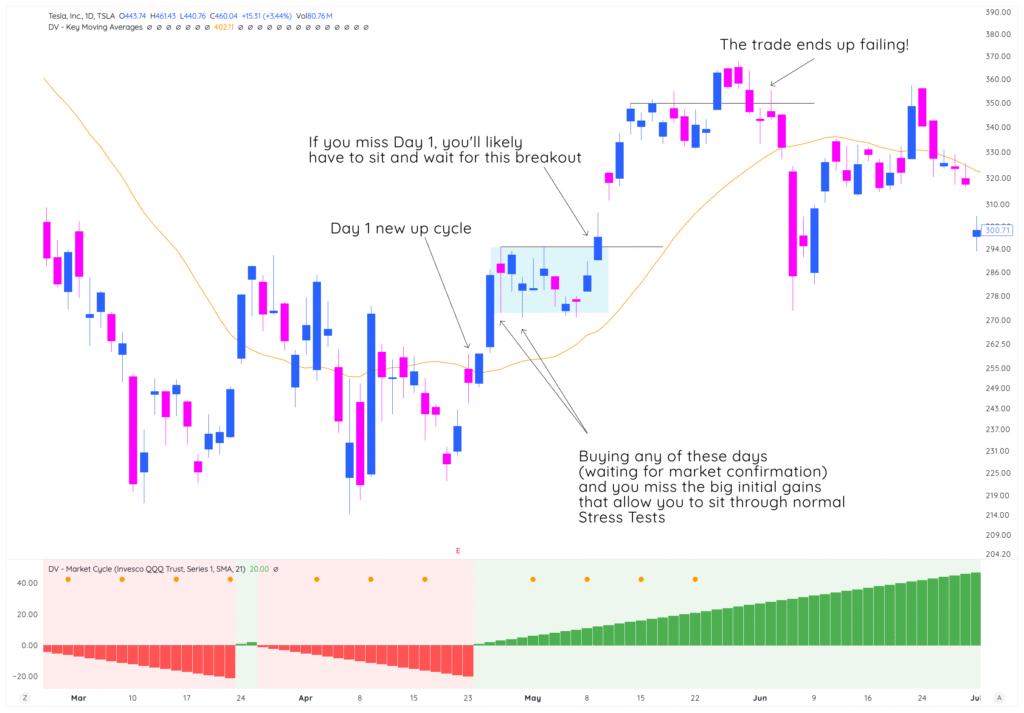
In the top pane, we’ve got $TSLA. In the bottom pane, we’ve got the Market Cycle indicator with QQQ and the 21-SMA.
What you see is clear:
- On Day 1 of the Up Cycle, TSLA has not broke out yet, but then breaks out the next day
- If you were waiting for Days 3-5 to “get positioned” because you didn’t believe in the Up Cycle signal, you likely got chopped up hard or didn’t catch the breakout at all
- It was only once we had two stress tests that Tesla then broke out higher, which gave a tradeable opportunity
But, if you missed Day 1, you gave up nearly 20% of gains before price broke out again higher (and the trade didn’t really materialize into much more after the second breakout anyways!).
Why Early Positioning Works
The biggest percentage moves happen in the first 3-7 days of a new cycle. When the market reclaims its 21-day SMA, most traders are still skeptical. And by the way, we don’t blame them for being skeptical.
It’s likely they’ve been burned by false starts before, but the key is this:
Are you willing to lose a couple % trying to position early in a trend for a chance to make 10-20% on your money (catching an early trend reversal that aligns with the Market Cycle system), or are you going to sit out and wait for “confirmation”, and then get shaken out anyways?
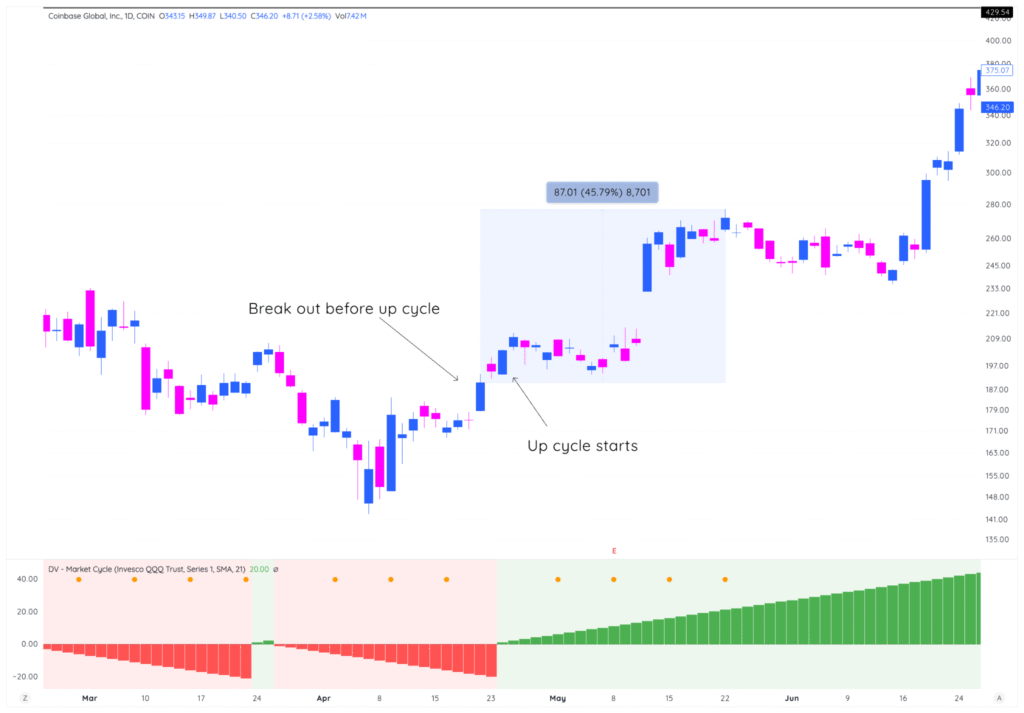
Look at the gains from these 2 names at the start of April’s up cycle:
COIN:
HOOD:
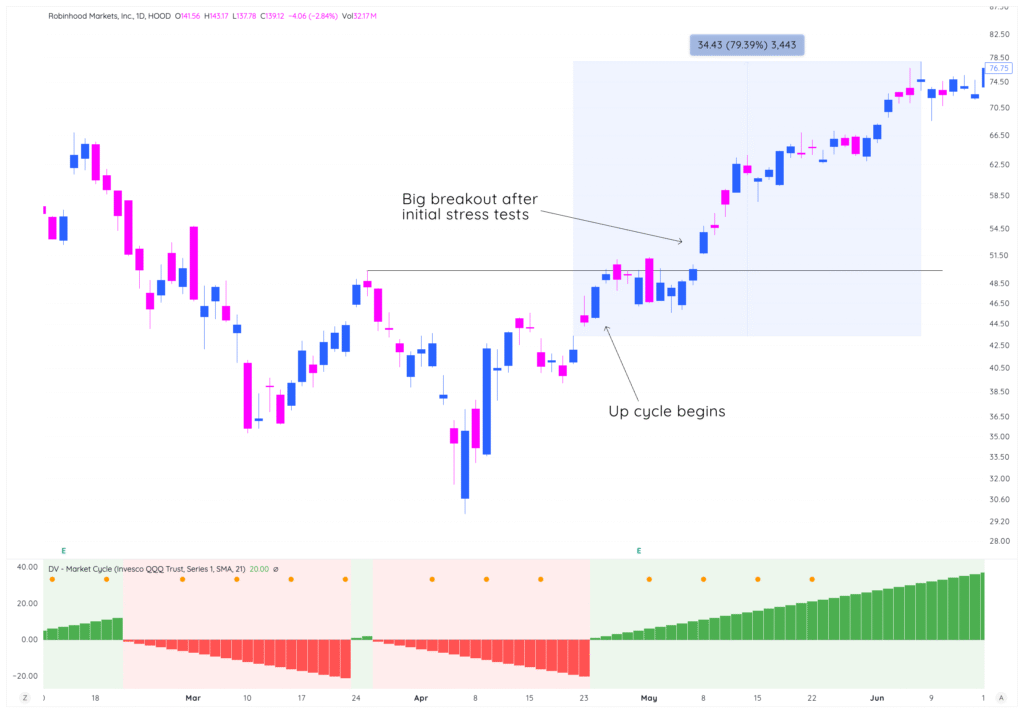
You’re capitalizing on explosive trend changes while the majority of traders are still “waiting for confirmation”.
The Risk: System Chop
The obvious risk is getting whipsawed. You enter Day 2, the cycle fails by Day 3, and you take a loss.
But remember Lesson 3 — we covered how to reduce system chop using the 21-day SMA and testing your specific ticker for clean signals. If you’ve done that work, you’ve already reduced the likelihood of false starts.
And here’s the key: when you’re right about the cycle, the reward far outweighs the risk of being stopped out.
The Big Advantage: Sitting Through Stress Tests with Profits
The other big advantage to getting positioned early in the cycle is this:
- Your early positioning allows you to sit through stress tests risking profits, not your actual $.
Let’s say you enter a stock on Day 1 of a new up cycle at $250.
By the time a stress test occurs, the stock is trading at $300. It pulls back to $260ish, which hurts, but you’re never in the red, never risking your own money.
This type of “aggressive” approach, making sure you’re aligned with an early up cycle, allows you to actually trade more calmly when stress tests do occur.
Compare this to the trader who waited for confirmation and bought at $275. When the stock drops to $260, they’re immediately down and are likely selling at loss (right before price turns up higher).
Using Stress Test Action to Peel Off or Increase Exposure
Every cycle gets tested around Days 4-7. This is when you decide what to do next.
Stress tests are your decision points. The way your stocks behave during pullbacks tells you exactly what to do.
Peel Off Exposure When:
- Stocks lose key moving averages – breaking below 10-day or 21-day MA shows weakness
- Break below breakout day lows – setup has failed, exit immediately
- Bearish engulfing bars on heavy volume – sellers are in control
- Leaders show weakness even as market holds – stock is weaker than the overall market
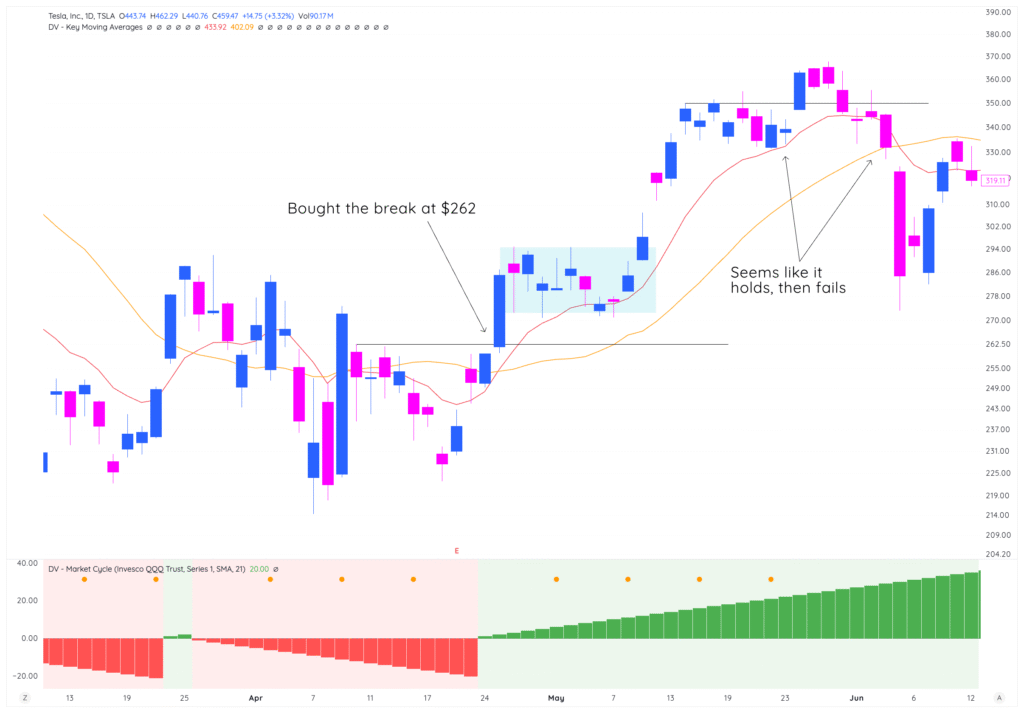
TSLA is a great example of a name that broke out with the new up cycle this year, and then ultimately failed. There’s no need for “hope” here, you simply sell and move on to the next when the setup doesn’t play out how you think it will. This is why stress tests are so key for stocks!
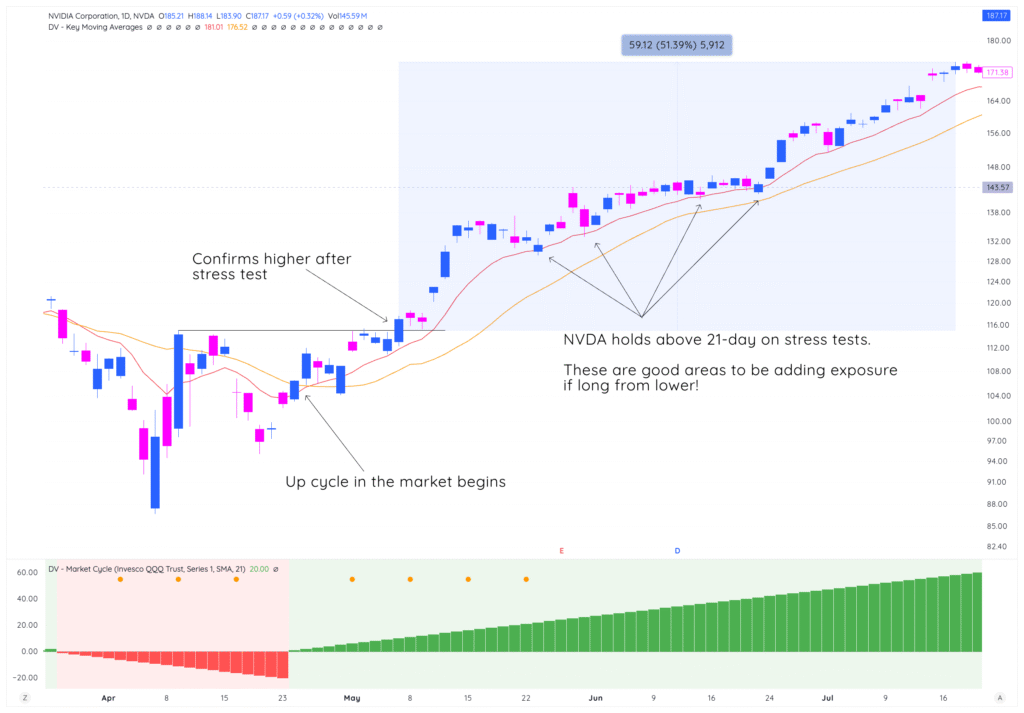
Add More Exposure When:
- Original positions hold key levels and move higher – showing institutional support
- New stocks break out of solid bases – secondary moves often have significant room
- Pullbacks to MAs get bought quickly – bounce off 10-day MA with volume is buyable
- Technical support holds with volume – stocks bouncing off prior highs or consolidation
Check out this NVDA example, confirming higher after a Stress Test & support at moving averages:
Managing Through the Full Cycle
Market cycles follow a rhythm: up → stress test → up → stress test → down.
It won’t follow that exact pattern every single time, but there is always a combination of an upwards thrust, a stress test, and then either a confirm higher or a trend change back downwards.
Here’s how you should be approaching trading this cycle:
- Days 1-3: Enter positions, larger sizes
- Days 4-7: First stress test – add or cut based on action
- Days 8-15: If cycle survives, continue higher (sweet spot), adding exposure/taking profits
- Days 12-18: Second stress test – evaluate again – if continue higher, good, if not, cut exposure
- Days 20+: Start preparing for cycle end
This pattern repeats in every market cycle.
When to Start Reducing Exposure
Two scenarios tell you it’s time to shift from offense to defense:
Late Cycle (Days 20+)
The average up cycle on QQQ over the last 13 years is around 20 days (we’ll give you this data in a later module). Obviously there are outliers, but this is when you should always defer to your individual stock’s action to tell you if a stress test is going to hold and you can add size, or if it’s going to fail and reduce size or get out completely.
What to do:
- Reduce position sizes on new entries
- Take partial profits at logical resistance
- Tighten stops on remaining positions
- Avoid new positions unless exceptional
After 5-8 Days Up Post-Stress Test
Markets move in waves. After 5-8 days up following a stress test, another pullback typically arrives.
What to do:
- Reduce size on extended positions
- Lock in some gains at logical exit points
- Prepare for next stress test
- Don’t chase breakouts already up a couple of %
Clear Signs to Go to Cash
Sometimes the cycle doesn’t just pull back — it ends:
- New breakouts failing consistently – market not ready to support moves
- Your win rate dropping – early warning system
- Low volume up days, high volume down days – no conviction behind moves
- Only 1-2 sectors still working – leadership narrowing
- Cycle breaks below 21-day SMA – positive cycle officially ended
A 2025 Case Study From April – Up Cycles Matter!
Let’s look at an example from early 2025.
Case Study: PLTR (Early 2025)
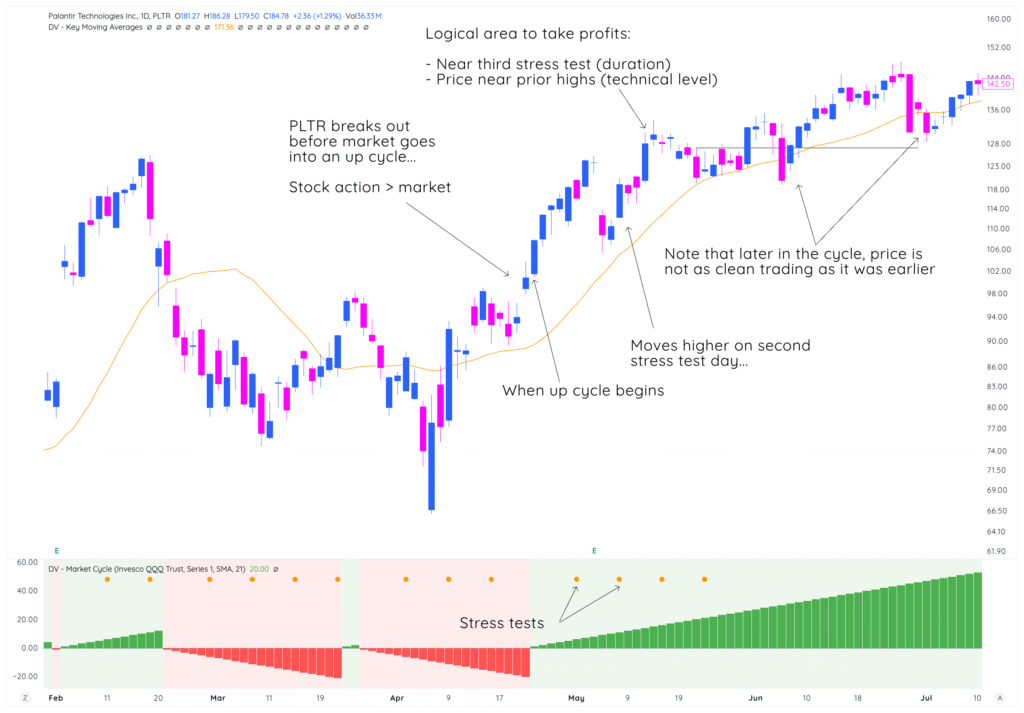
Entry (early up cycle): PLTR broke out just under $100 right before the QQQ up cycle started — and you would have had to either buy on the follow through breakout or wait until a stress test to get long the name if you weren’t long on breakout day.
You can see why getting positioned early in the trend can be so beneficial for your portfolio when it works.
First Stress Test (Days 10-11): Market pulled back. PLTR didn’t really budge — the only thing that affected it was earnings, where it was down > 10%.
Decision: Hold and potentially add. Once it shaped up and bounced, you could be adding on the “moves higher” day.
Mid-Cycle (14-18): PLTR moved back higher with force, which confirmed its leadership status.
Second Stress Period (Days 19-23): After the surge higher, price saw selling at logical points (Near the second stress test period, third stress test dot on the indicator, as well as a previous high — clear technical resistance).
Trading Actions to take: It would make sense to continue to hold a portion because you’re in an early leader, but selling a portion makes sense here as well.
Late Cycle (Days 23+): After PLTR holds the moving average, you can see price didn’t make as much progress as quickly as it once was. This tell us it’s in a later stage — and that we should be cautious of:
- New breakouts failing more
- Volume declining on up days
- Few sectors still working
While it continued to work (and still is as of September), the hold has gotten more difficult. A great example of why getting positioned early in up cycles allows you to capture huge momentum quickly, and then trail your stops higher.
Key Takeaways
- Trade bigger early (Days 1-3) when risk/reward is optimal
- Use stress tests (Days 4-7) as checkpoints to add or reduce
- The pattern repeats: up → stress test → up → stress test
- Start reducing after Day 20 or 5-8 days post-stress test
- Your stocks’ action at key levels tells you when to exit
- Going to cash is a position
Looking Forward
Boom! We covered a lot today.
The next lesson is going to add on to today’s — helping you determine how much size to give names and exposure guides to work with at differing periods of the cycle, depending on your experience level as a trader.
Talk then!