You know when to enter and exit. Now the question is: how much size should you use?
Another critical mistake traders make is position sizing (we have a whole mini-course on this!) the same throughout the cycle, and this couldn’t be more opposite than what professional traders do.
What separates the professional traders from everyone else?
They implement Progressive Exposure early in the Market Cycle, so that they let the market prove them right (and allows them to add exposure risking only profits).
Using a one-size-fits-all approach to Market Cycle sizing is a great way to get crushed on a couple of false starts, and also puke positions on regular stress tests because your sizing is too aggressive.
This lesson shows you how to avoid this — and bend with the market.
The Progressive Exposure Approach
Progressive exposure is a concept from Mark Minervini’s trading methodology. The idea is simple: start with a couple of positions, let them prove themselves, and then scale up as the cycle proves itself or scale down as it fails.
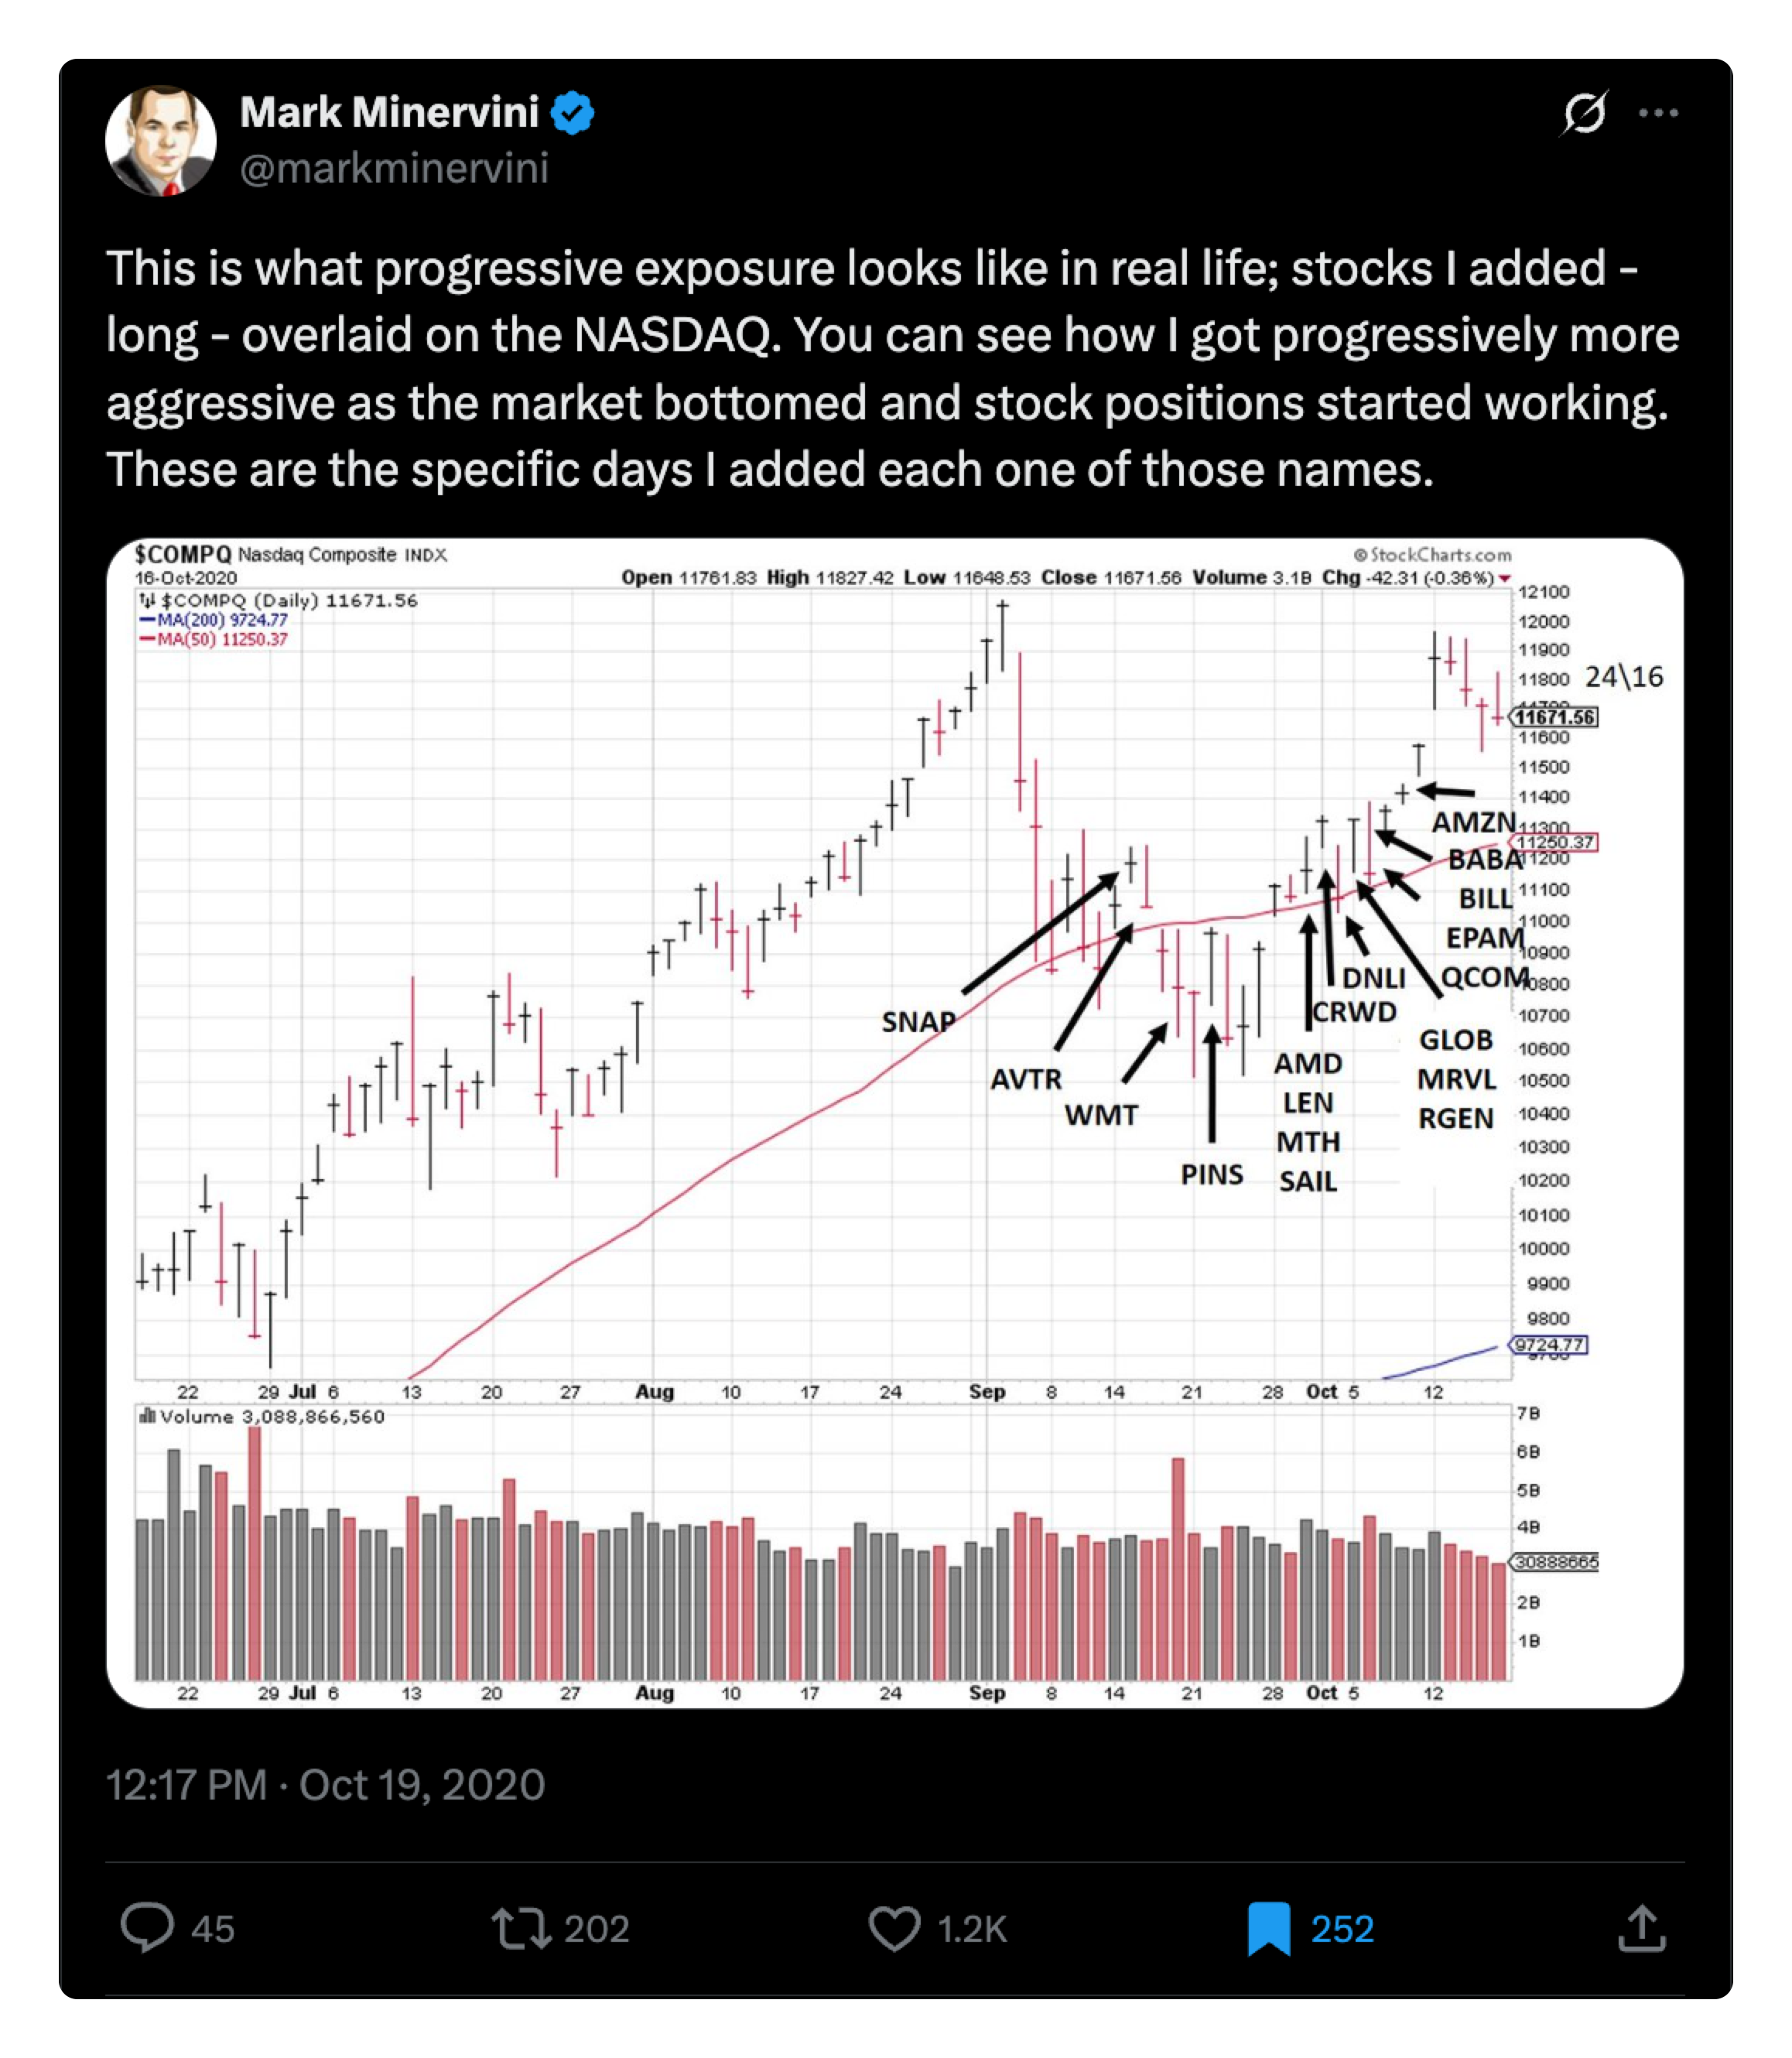
Above is a great example from Mark, and we went through this in depth in our position sizing course. He’s not implementing the Market Cycle system here, as you can see with his entries while the market was still below the 21-day (not ideal for our style), but it’s clear he was more aggressive with his exposure soon after the QQQ closed above the 21-day.
That’s the whole point — get aggressive when price goes your way (early) and let the market prove you right.
Why This Works
- Takes advantage of strength off lows – you’re positioned but not overexposed
- Allows you to sell into strength – if positions rip 10-15% in days 1-3, you can take profits
- Gives you room to add – if cycle confirms, you have capital to deploy
- Protects capital on failures – if cycle dies on Day 3, you only had a portion invested, which means only a portion at risk
Starting Small – Days 1-3 (50% Invested)
Don’t go all-in immediately on Day 1 of a new cycle. That’s how you blow up accounts.
Instead, start with 50% of your target exposure spread across 3-4 positions.
Example
- Total portfolio: $100k
- Target full exposure: $100k (100% invested)
- Days 1-3: Start with 50% invested ($50k) across 3-4 stocks
- Each position: $12k-$17k
What This Looks Like
Day 1 of new up cycle:
- Stock A breaks out, you buy $15k position
- Stock B breaks out, you buy $15k position
- Stock C breaks out, you buy $12k position
- Stock D breaks out, you buy $8k position
Total invested: $50k. Cash remaining: $50k.
Why Only 3-4 Positions?
You want concentration in your best ideas early. More positions = more to handle = harder to manage during stress tests.
3-4 stocks is enough diversification without spreading yourself too thin.
Building to Full Exposure – Days 4-8 (80-100% Invested)
After the first stress test (Days 4-7), you have key information that will tell you your next actions:
- Did your initial positions hold key levels?
- Are new stocks breaking out?
- Is the market staying above its 21-day SMA?
If yes to most of these, it’s time to scale up to 80-100% invested.
Signs to Add Exposure
- Original positions holding 10-day or 21-day moving averages during pullback
- Market continuing above 21-day SMA through stress test
- Multiple sectors showing strength (not just 1-2 stocks)
- Your recent win rate staying healthy (6+ winners out of last 10 trades)
How to Add
Option 1: Add to existing winners Stock A held its 10-day MA during stress test and bounced. Add another $5k-$8k to the position.
Option 2: Initiate new positions Stocks E and F are breaking out on Day 7. Start new $12k-$15k positions in each.
Option 3: Combination Add $5k to Stock A, start new $15k position in Stock E.
Let’s walk through an actual example from early 2025, using multiple stocks overlaid on the QQQ (like the Minervini example above):
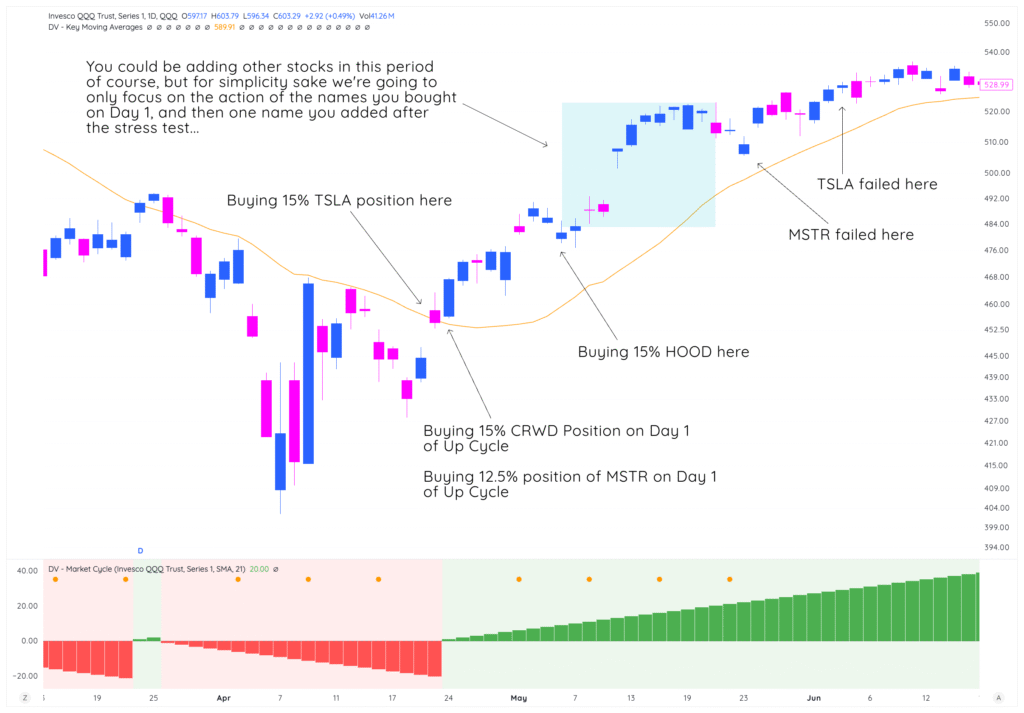
Starting Position (Days 1-3):
- TSLA: $15k position when it breaks out (before Day 1 of the Up Cyle… use your feel here)
- CRWD: $15k position when it breaks out (right on Day 1 of Up Cycle)
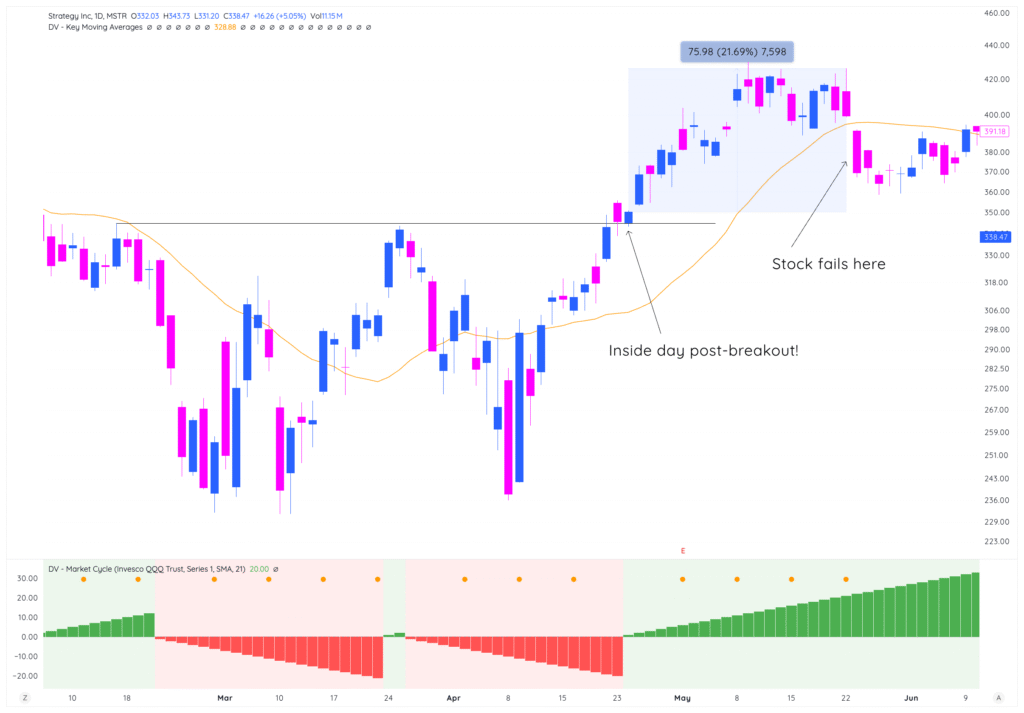
- MSTR: 12.5k position when it rests on inside day above breakout (on Day 1 of Up Cycle)
- Total: $42.5k invested, which is 42% exposure
After Stress Test (Days 5-7):
- TSLA, CRWD, MSTR are all higher (and you’re in the green on them)
Let’s say you’re also tracking HOOD at the time, which is shaping up well. You then buy it on Day 9 of the Up Cycle after the market shakes off any weakness.
Of course you could have been buying other names, because the stocks you started with were working.
But this goes to show how you can dip your toes in, get feedback with decent size, and then add when the time is right.
Managing Full Exposure – Days 8-15 (80-100% Invested)
This is the sweet spot. The cycle has survived its stress test, momentum is building, and you should be at or near full exposure.
But don’t just sit there. Active management is key.
Position Management During Sweet Spot
- Take partial profits on extended moves – stock up 15-20% in a week? Sell 25-50%
- Add on pullbacks to MAs – stock pulls back to 10-day MA? Add to position
- Rotate into fresh setups – use profits from extended positions to fund new breakouts
- Keep 4-6 positions active – diversification across themes/sectors
Don’t Let Winners Become Losers
Let’s look at the right side of this chart now — highlighting where MSTR and TSLA both failed (even when the market was in an Up Cycle, and not stress testing).
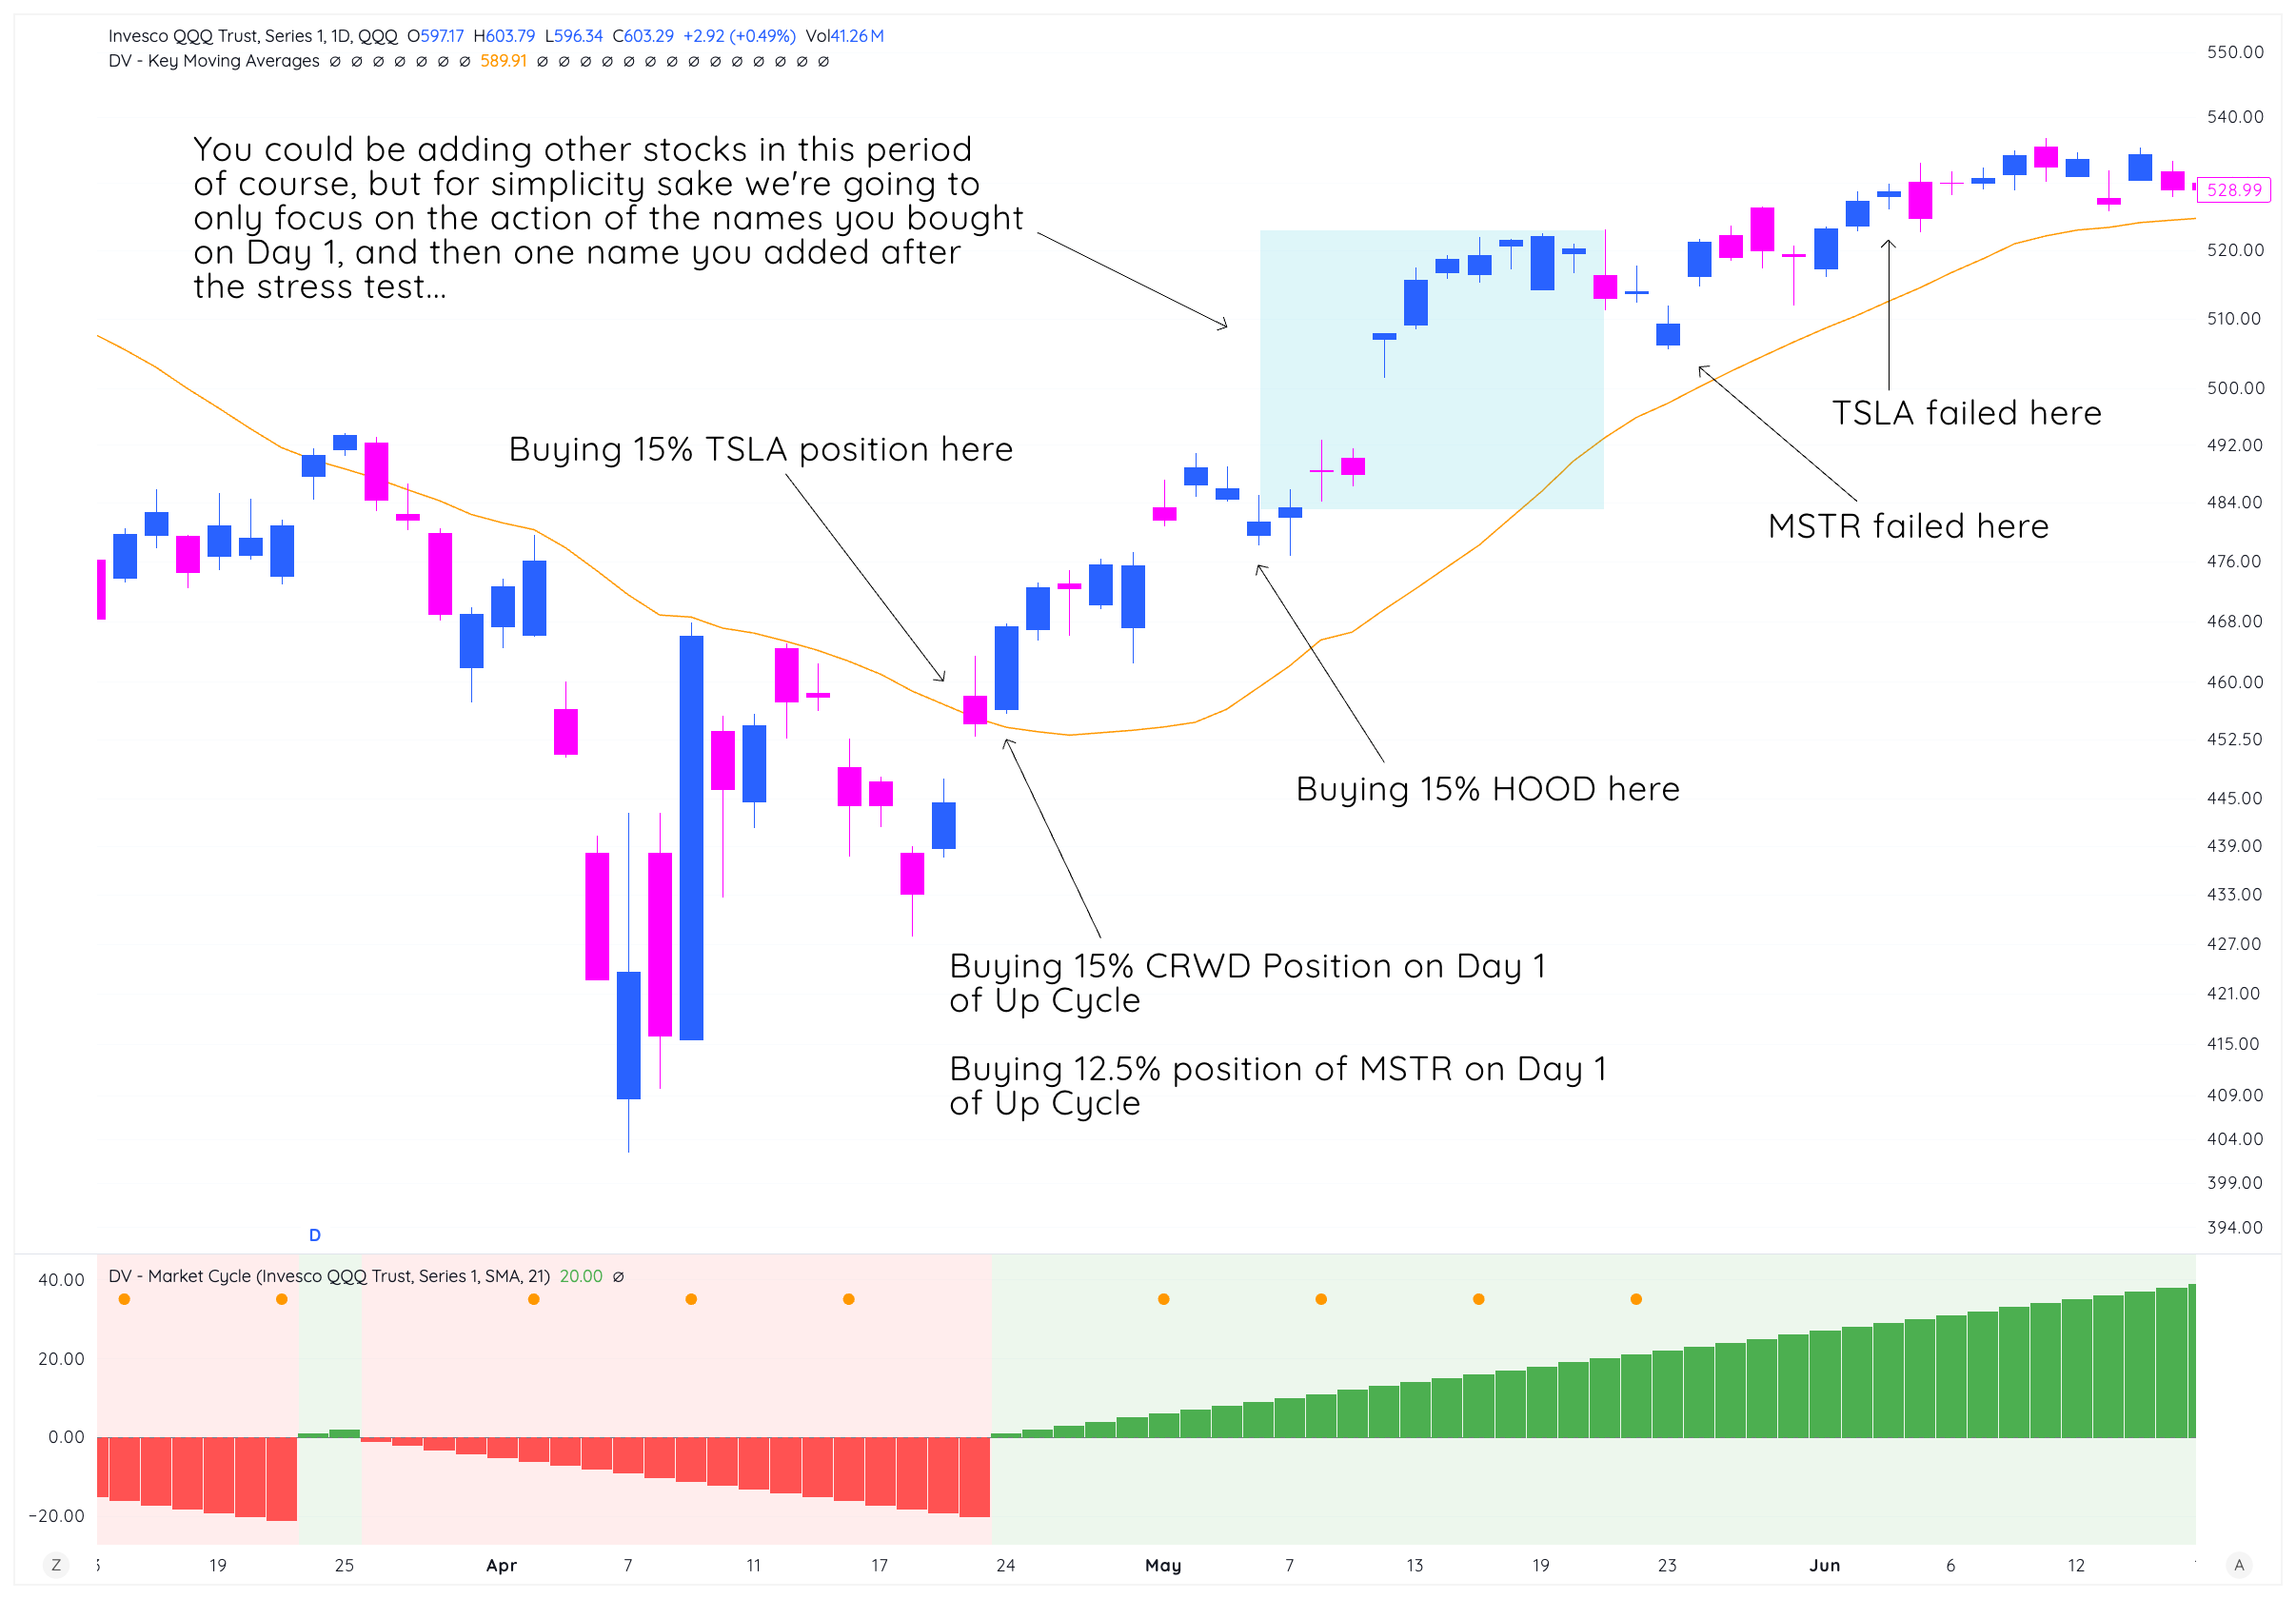
There are a couple of things to note:
- You never want to get married to a stock just because the market is uptrending
- TSLA, MSTR both broke their 21-day MAs on the highlighted dates, which would have required you to sell them (albeit higher than from where you initially bought!)
But, other names like CRWD and HOOD were working great at this time, so you could have been looking to add exposure to them to feed your winners once you got stopped out of the laggards.
Then, we arrive at the latter part of the cycle:
Reducing Exposure – Days 15+ (40-60% Invested)
Once a cycle reaches Day 15+, or after 5-8 days straight up following a stress test, it’s time to look for reasons to scale down (or stay invested… just depends on the action!).
What to Do If The Market Looks Exhausted/Extended After A Strong Run
- Take profits on most extended positions – anything up 20%+ gets trimmed, and leave the final piece to trade against the moving averages
- Reduce new position sizes – if starting new positions, make them 5-10% of portfolio instead of 15%
- Tighten stops – move stops closer to current price on remaining holdings
- Build cash – raise 30-50% cash for next cycle opportunity or for stocks that re-break out if the market does continue to stay strong
When Stocks Fail at Technical Levels
This is critical. When stocks break key levels, you must reduce immediately:
- Stock breaks below 10-day MA: Reduce 25-50% of position
- Stock breaks below 21-day MA: Exit remaining position
- Stock breaks below breakout level: Exit immediately, no questions
Don’t hope it comes back. The stock is telling you it’s not working — which is exactly what we saw with TSLA and MSTR in the QQQ example above. Here are their charts, for your reference:
TSLA Failure:
MSTR failure:
The Numbers: Conservative vs Aggressive
Now let’s say you’re not comfortable getting 50% invested in 4 stocks right off of a market low — that’s totally okay.
Your exact exposure levels depend on your experience and risk tolerance.
Conservative Approach (Newer/Low Risk Tolerance Traders)
- Days 1-3: 30-40% invested
- Days 4-8: 40-60% invested
- Days 8-15: 60-100% invested
- Days 15+: 60-75% invested if stress tests hold
- Failed cycle: 0-20% invested quickly on failure
Aggressive Approach (Experienced Traders)
- Days 1-3: 50-60% invested
- Days 4-8: 80-100% invested
- Days 8-15: 80-100% invested
- Days 15+: 50-60% invested – selling into strength
- Failed cycle: 0-30% invested
Key Principles
- Start with 50% of target exposure early in cycle – protects from false starts
- Scale to full exposure only after stress test confirms cycle has legs
- Take profits and reduce as cycle matures past Day 15
- Exit quickly when stocks break technical levels – no hoping
- Keep some cash for next opportunity – don’t be 100% invested late cycle
One of the points we want to hammer home is this:
Trade bigger earlier in the cycle, and smallest at the latter stages of a cycle.
Most traders lose a bunch of their early cycle gains because they size up too late in a trend, and then get hammered on a gap down or a regular correction.
So, remember:
- Use progressive exposure: start at 50%, scale to 100%, reduce to 40-50%
- Let the cycle prove itself before going full exposure
- Take profits on extended winners (up 15-20%)
- Cut losers quickly when they break technical levels
- Keep 20-30% cash even at peak cycle for flexibility
- Match your aggression level to your experience
Looking Forward
You now understand how to size positions throughout the cycle — starting at 50%, scaling to full exposure when the cycle proves itself, and reducing as it matures.
But how long do these cycles actually last? And how consistent are they?
In the next lesson, we’re going to look at real data spanning over 12 years of QQQ up cycles. You’ll see the average cycle length, the distribution of short vs long cycles, and what this tells us about timing our entries and exits.
Then we’ll go even deeper with historical SPX examples from three critical periods:
- 1998-2000: The dot-com boom
- 2001-2003: The crash and recovery
- 2007-2008: The financial crisis
These case studies will show you exactly how the Market Cycle System would have guided you through some of the most extreme market conditions in recent history — and how it could have saved you from massive losses or positioned you for huge gains.