Your Trading Results Are Your Best Market Indicator
One of the secret gems to trading is shaping your trading around the outcome of your most recent 5-10 trades.
It’s something most traders never figure out: your own win-loss record is telling you exactly what the market wants to do next.
If your last five trades are working, the market is cooperating. If they’re getting stopped out, it’s fighting you. This isn’t rocket science, but it requires discipline to actually listen to the feedback the market is giving you.
Most traders ignore this feedback and keep trading the same way regardless of whether they’re in a winning streak or getting their heads handed to them. Smart traders adjust their position sizes based on what the market is actually telling them through their results.

Understanding The Market Cycle Framework
If you’re going to be a successful trader, you must understand that 75% of stocks follow the market’s direction. If you aren’t trading with the trend, you’re trading against it… so building a Market Cycle Framework is one of the highest impact actions you can take to improve your trading (we’ll get to how this fits into position sizing in a second).
Here’s the simple 3-step framework that works:
Step 1: Pick Your Market Index Choose QQQ, SPY, or whatever index aligns with your trading style. Growth traders often use QQQ. Value traders might prefer SPY. The key is consistency – stick with one primary index for your trend identification.
Step 2: Define Your Trend Use a simple moving average system. The 21-day simple moving average works well for swing traders. When your index closes above the rising 21-SMA, you’re in an up cycle. When it closes below, you’re in a down cycle.
Step 3: Count Your Cycles Track how many days the market stays in each cycle. A 20-day down cycle followed by a 46-day up cycle tells you something about market rhythm and helps you anticipate what comes next.
Position Sizing Through the Market Cycle
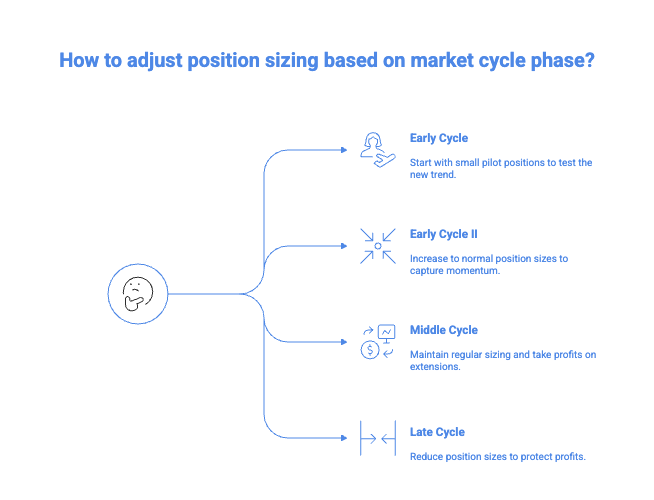
It’s one thing to track the cycles — it’s another to use the data and actually trade with it. This is where most traders blow it. They use the same position size whether they’re at the start of a fresh uptrend or 40 days into an extended rally. Here’s how to adjust your sizing based on cycle phase:
Early Cycle (Days 1-3): Start with small pilot positions when your trend system first turns positive. Even if you’re confident, the market needs to prove the new cycle is real. Use quarter to half-sized positions initially.
Early Cycle II (Days 4-10): This is when you can size up to your normal position sizes. You’ve likely already gotten feedback from your initial trades that’s positive, and you should start looking to put on full positions to capture early trend momentum.
Middle Cycle (Days 11-25): Since you’ve already gotten strong feedback from your trades, you can stick with regular sizing, but look to take profits into any extensions above rising moving averages or big price moves.
Late Cycle (Days 25+): Start reducing position sizes even if the trend continues. Extended moves become increasingly fragile. New breakouts often fail. Protect the profits you built earlier in the cycle.

Reading the Real-Time Signals
The market gives you constant feedback about whether to press harder or pull back. Here’s what to watch:
Cooperative Market Signals:
- Your recent positions are showing immediate follow-through
- Breakouts hold and extend rather than failing
- You’re seeing 15-20+ quality setups in your scans
- Leading stocks are making new highs while the market consolidates
Non-Cooperative Market Signals:
- Positions immediately go against you after entry
- Breakouts fail within days of triggering
- Your scans show fewer than 5-10 decent setups
- Leading stocks start breaking down or stalling
The Setup Count Method: Experienced traders use setup count as their primary market gauge. If you normally see 20+ setups in good markets and suddenly you’re only finding 5-8, the market is telling you to reduce exposure. More setups appearing means increased exposure.
The Stress Test Reality
Every fresh uptrend faces stress tests around days 4-6. This is when weak hands get shaken out and the market tests whether the rally has real institutional support. Here’s how to handle stress tests:
Single Stress Test: Normal and healthy. Hold your winners if they stay above entry points. Add to positions that show strength during the pullback.
Multiple Stress Tests: Three stress tests back-to-back will break the market cycle. Start reducing position sizes and avoid new full-sized positions.
Failed Stress Test: If leaders break key support levels on heavy volume during the test, the cycle may be ending. Reduce exposure immediately.
System Chop… What does it mean and how does it affect you?
No market cycle system works 100% of the time. You’ll get whipsaw periods where the market chops around your moving average – above, below, above, below. This is normal and unavoidable.
During choppy periods:
- Reduce position sizes across the board
- Focus on the highest-quality setups only
- Use additional filters like breadth metrics or sentiment indicators
- Accept that some periods aren’t meant for aggressive trading
The key is recognizing chop early and adjusting rather than fighting it with oversized positions.
Putting It All Together
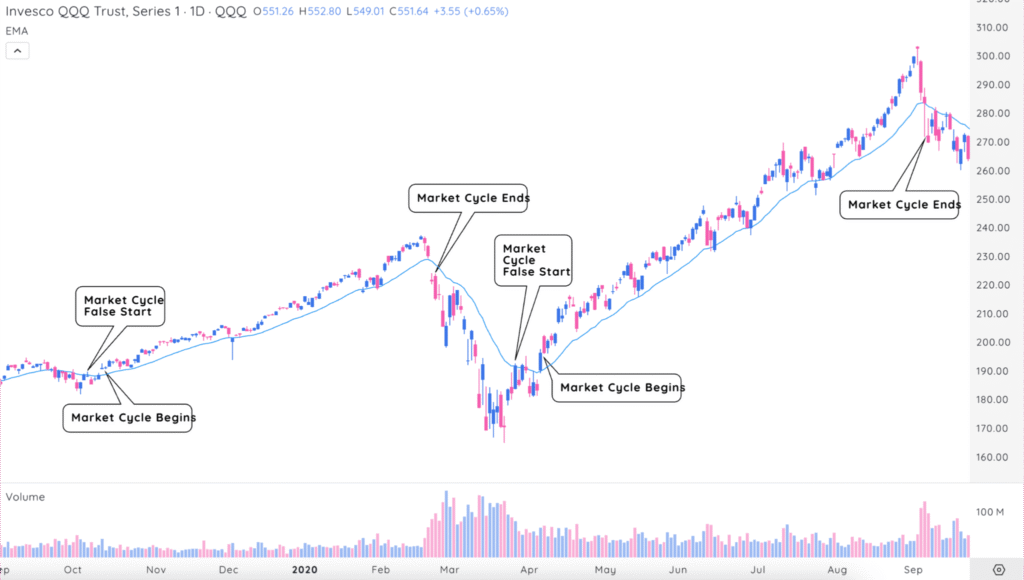
Let’s see how you can put a complete market cycle system to work with a real-world example:
Here’s the QQQ from 2019-2020:

- Day 1-3 after the trigger:
- Enter a mix of QQQ and one or two leading stocks.
- Keep the risk per trade low.
- Stress test day:
- Hold winners through a brief dip if they remain above the entry.
- Drop positions that slice through support on heavy volume.
- Days 5-15: trend resumes after stress test
- Look to put regular sized positions on, taking advantage of early trend momentum.
- Let early winners breathe; raise stops only under obvious support.
- Late stage:
- Reduce the size on extended names.
- Avoid adding full new positions.
Following this rhythm you participate when odds are stacked in your favour and sit out when they are not.
What’s Coming Next
The next lesson covers Mark Minervini’s progressive exposure method – how he systematically scales positions based on market feedback. You’ll see the exact real-world examples from his 2020 COVID recovery and 2025 market re-entry, showing how he builds from single pilot positions to 20+ positions when the market cooperates.
The progressive exposure method builds directly on the market cycle framework we just covered!
Key Takeaways
Market cycles are human psychology repeating in predictable patterns. Your own trading results provide the best real-time feedback about market conditions. Position sizing should match the cycle phase – smaller early, size up quickly if feedback is good, and then smaller again late. System chop is unavoidable, so reduce size during whipsaw periods.
Most importantly, the market tells you what to do next through setup availability and trade feedback. Stage 1-2 traders should interpret these signals, while Stage 3+ traders can begin anticipating cycle changes.
Next Action: Set up your market cycle tracking system this week. Pick your index, define your trend rules, and start counting cycles. Track your setup count daily and notice how it correlates with your trading results. Let the market guide your position sizing decisions instead of fighting what it’s telling you.