As we covered in previous lessons, there are two ways to position size:
Method 1: Size based on risk, and the % risk on the account (review lesson 4)
Method 2: Size based on the number of edges, which is what we’ll cover today.
The key thing to know:
Not All Setups Are Created Equal!
Here’s something most traders never figure out: a stock breaking out with three edges deserves a bigger position than one breaking out with one edge. Yet most traders use the same position size for every trade, treating a mediocre setup the same as a perfect setup — and this leads to a huge discrepancy of performance!
Mike Webster and other well-known, successful traders use edge-based position sizing:
When the setup they see has multiple factors and edges aligned, they size higher. When a setup is still good, but may only have 1 or two things going for it, they size lower.
More edges equal more conviction, which equals bigger positions.
This lesson shows you exactly how to identify edges, rank your setups, and scale your position sizes based on conviction level.
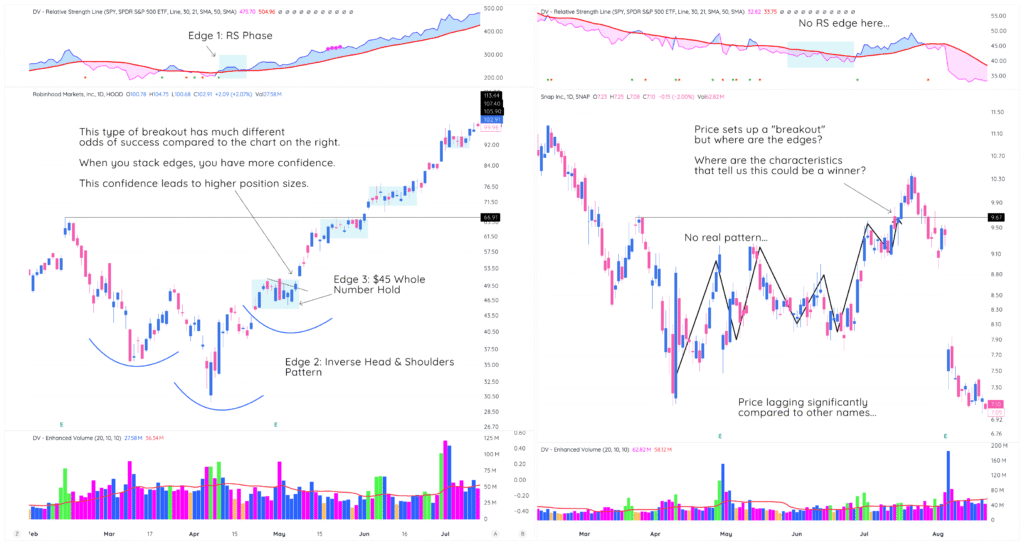
Before we go any further, just compare the two setups above.
One has multiple edges, one doesn’t.
Are you surprised which one worked out?
The TraderLion Edge Framework
Professional traders look for specific edges that repeat in winning stocks. The TraderLion framework identifies four primary edge categories:
1. High Volume Edges
- HVE: Highest Volume Ever
- HVIPO: Highest Volume Since IPO Week
- HV1: Highest Volume in 1 Year
High volume signals institutional participation. When combined with news catalysts like earnings or other ground-breaking reports, these create the strongest possibility for upside moves. For that reason, we want to size higher in them.
2. Relative Strength Edge
- Relative Strength occurs when a stock outperforms the benchmark — which is usually the Nasdaq or the S&P 500.
- The Edge: Relative Strength Phase – when the stock’s RS line is above its RS-line 21-day, signaling outperformance over the last couple of weeks.
Other edges to look for:
- RS line making new highs before price
- RS line making new highs with price
- RS line holds up while price is above key moving averages during corrections
There are a ton of different RS edges that winning stocks display before they break out.
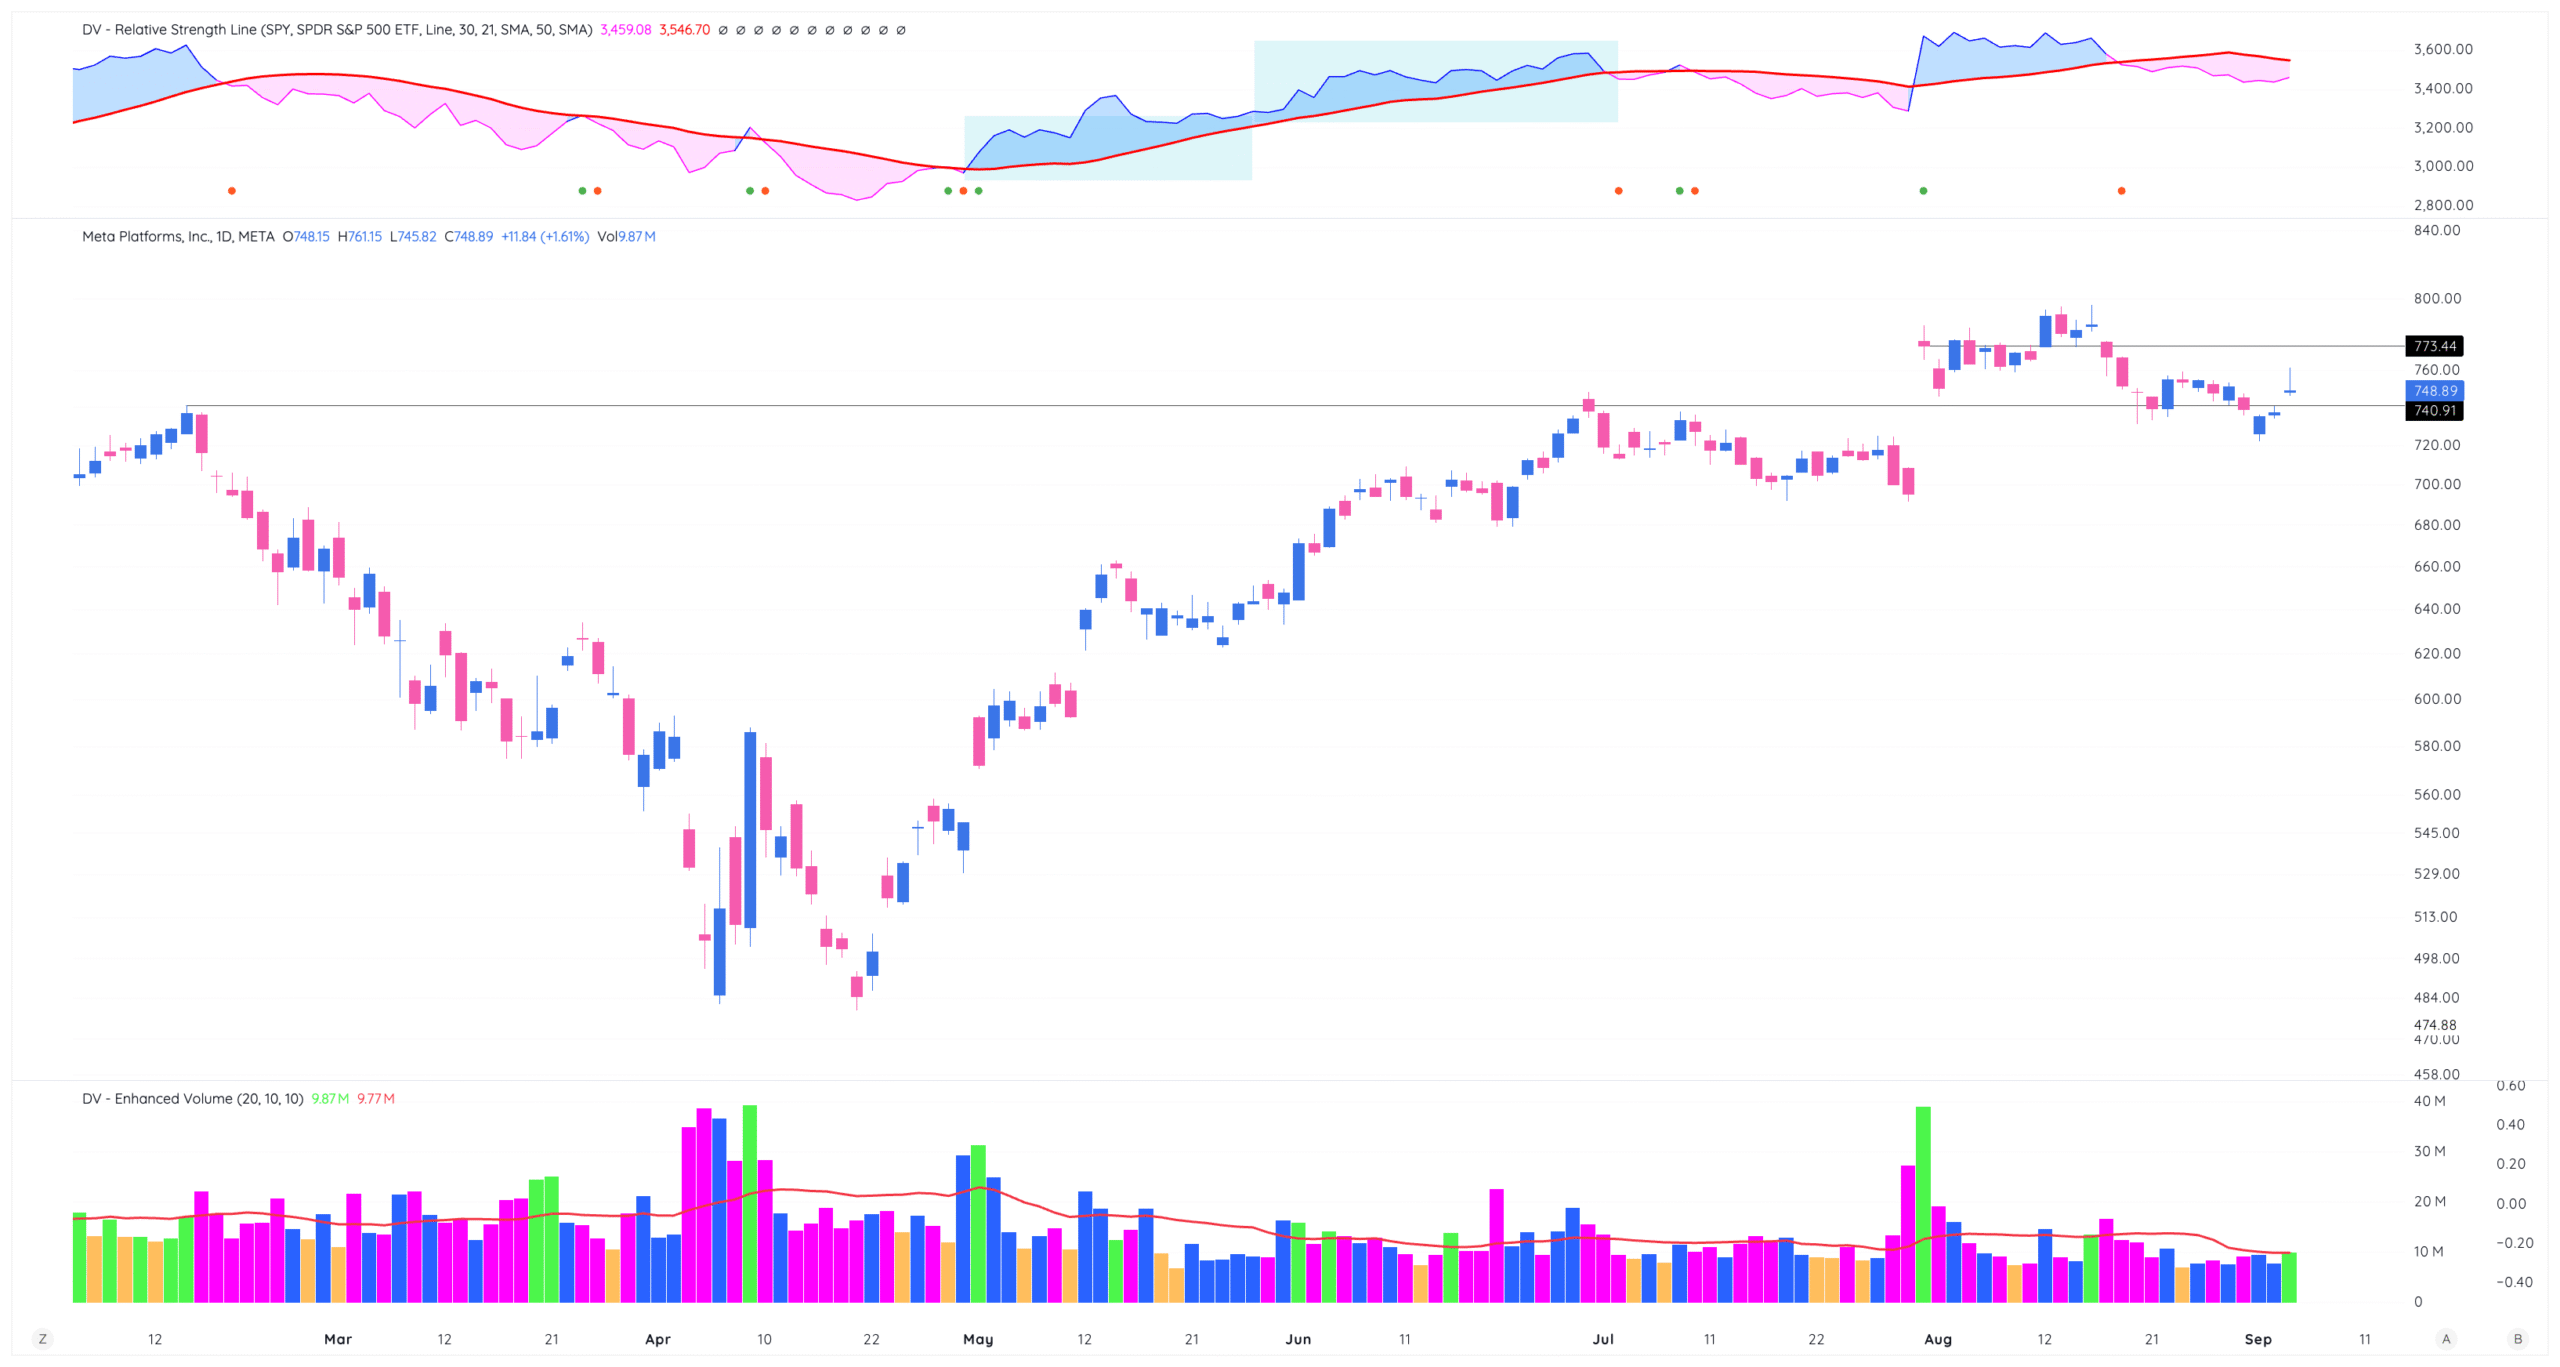
Check out the META example below from the 2025 bottom:
- RS line begins an RS phase only days after price bottoms
3. Technical Setup Edge
- Clean breakout forming underneath resistance in a sound base
- VCP characteristics (volatility contraction)
- Stage 1 or Stage 2 bases (higher probability)
- Volume confirmation on breakout
- Inside day setup
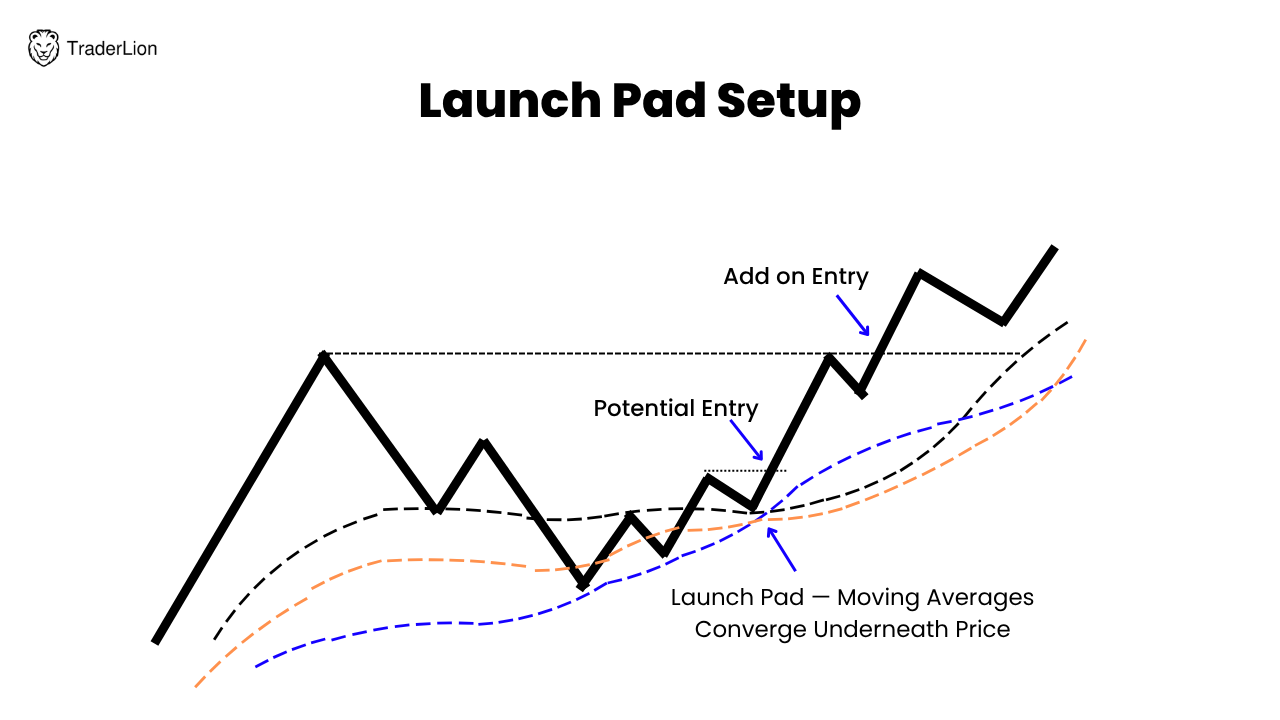
- Launch pad setup (example below)
The Edge-Based Scaling System
Here’s how to translate edge count into position size:
Base Position Size: 8-10% (Phase 1 Traders), 12-15% (Phase 2 Traders), 15-20% (Phase 3+ Traders)
Scaling Rules:
- 0 Edges: Pass on the trade
- 1 Edge: 75% of base size
- 2 Edges: Full base size
- 3 Edges: 125% of base size
- 4+ Edges: 150% of base size (maximum)
Real Example:
Phase 2 Trader with 12% base size:
- 1 Edge setup: 9% position
- 2 Edge setup: 12% position
- 3 Edge setup: 15% position
- 4+ Edge setup: 18% position
This ensures your biggest positions go to your highest-conviction trades.
Identifying Edges in Real Setups
Let’s break down a real example using Apple (AAPL) during its 2023 breakout:
AAPL April 2023 Breakout Analysis:
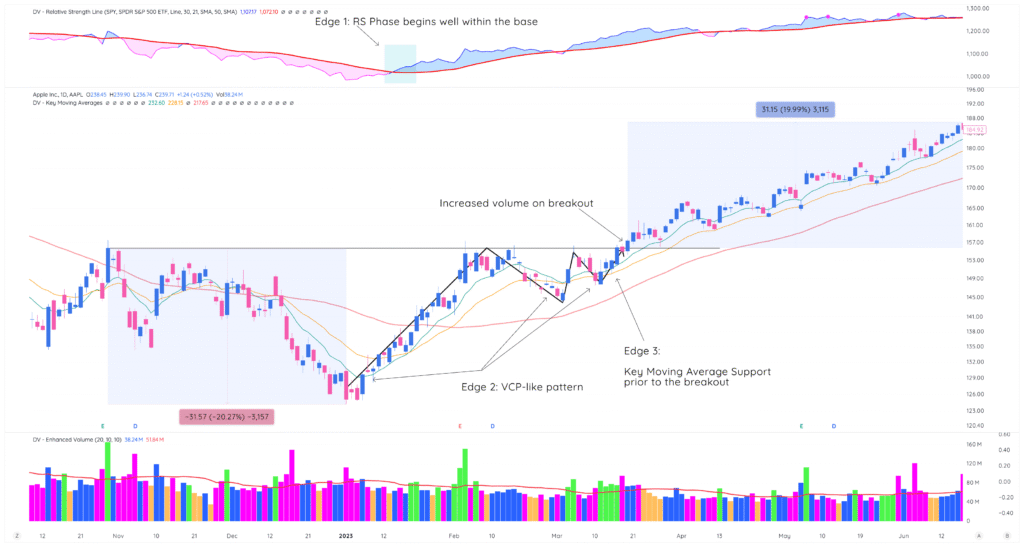
✓ Relative Strength Phase: Begins At Lows
✓ VCP-like Pattern: The VCP is a well-known, high probability breakout pattern
✓ Moving Average Support Prior To Breakout: Price holds the 21-day prior to breaking out, often a sign of institutional support prior to big moves.
Edge Count: 3 edges
Position Size: 125% of base (15% for Phase 2 trader with 12% base)
100k Account: 125% of 12% size — $15,000, which is 15% size
Logical Stop Loss: A logical stop was about -3.62% away from entry, which is only risking about .54% on the account!
The Stage Analysis Component
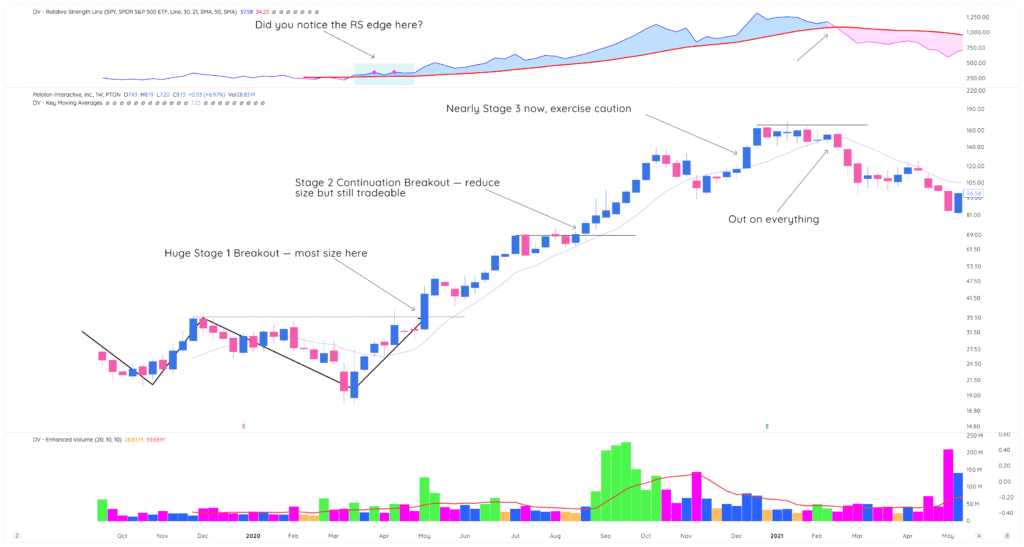
Not all technical setups have equal odds. The stage of the base pattern significantly affects success probability:
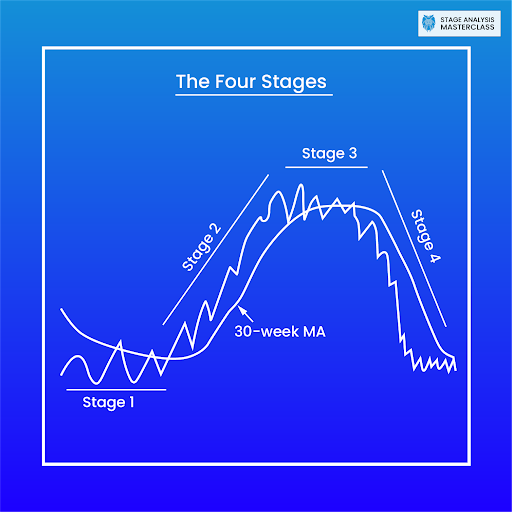
Stage 1 Bases (First breakout): Highest probability, use full edge-based sizing
Stage 2 Bases (Second breakout): Good probability, use standard sizing
Stage 3+ Bases (Late-stage): Lower probability, reduce sizing by 25-50%
This adds another layer to your position sizing decisions beyond simple edge counting.
The TraderLion Calculator Approach
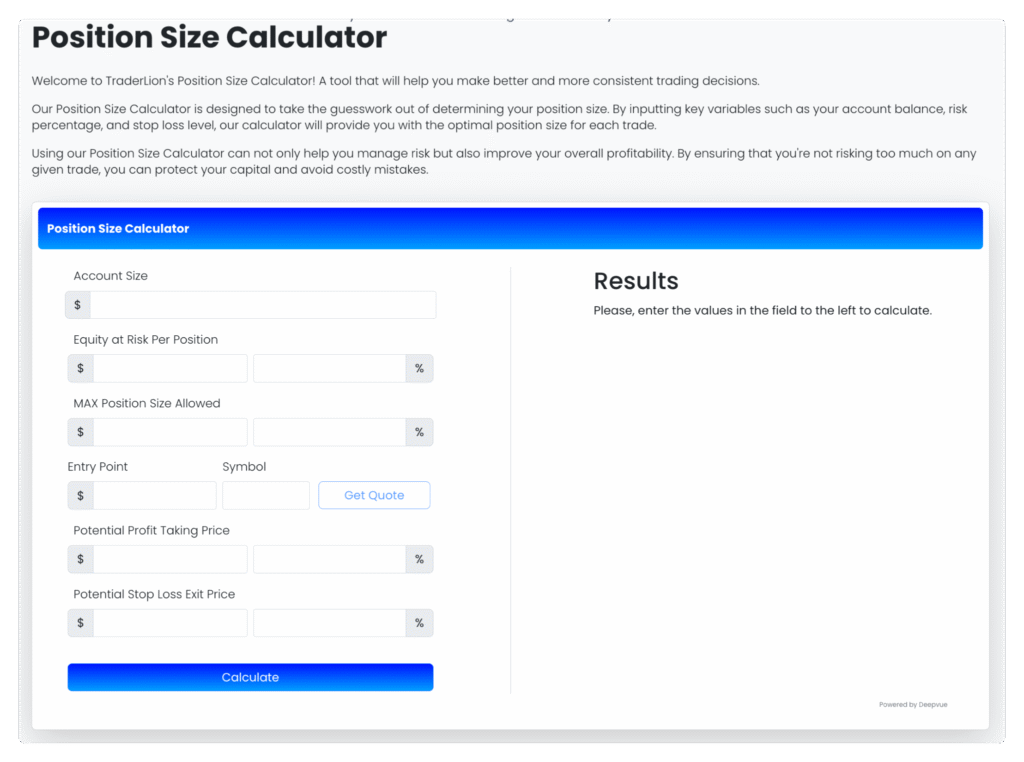
The TraderLion position sizing calculator automates this process:
Inputs:
- Account size
- Risk percentage (based on your phase)
- Edge count (1-4+)
- Market cycle phase
- Stop loss distance
Output: Exact share count based on your edge-based scaling rules
This removes emotion and ensures consistent application of your sizing methodology (click on the image below to go straight to the calculator!).
Phase-Specific Edge Requirements
Phase 1 Traders:
- Minimum 2 edges required for any trade
- Focus on learning edge identification
- Conservative scaling (maximum 125% of base)
Phase 2 Traders:
- Can trade 1-edge setups in good markets
- Full scaling system (75%-150% of base)
- Track edge success rates to refine system
Phase 3+ Traders:
- May anticipate edges before they fully develop
- Can use higher maximum scaling (up to 200% in exceptional setups)
- Advanced edge combinations and market timing
Building Your Edge Checklist
Create a simple scoring system for each potential trade:
Technical Edges:
□ Clean base pattern (VCP characteristics)
□ Volume confirmation on breakout
□ Stage 1 or 2 base (not late-stage)
□ Above key moving averages
Fundamental Edges:
□ Earnings growth acceleration
□ Revenue surprises
□ Raised guidance
□ New product/service launch
Market Edges:
□ Sector leadership
□ Relative strength vs market
□ Institutional accumulation signs
□ Theme/trend alignment
Count your checkmarks and size accordingly.
Edge Evolution and Adaptation
Edges change effectiveness over time. What worked in 2020 may not work in 2025. Track your edge success rates quarterly:
High-performing edges: Increase weighting in your scoring system
Low-performing edges: Reduce weighting or eliminate entirely
New edges: Test with smaller positions before full sizing considerations
Market dynamics shift, and your edge identification must adapt accordingly.
What’s Coming Next: Market Cycle Integration
Edge-based sizing must adapt to market conditions. Your position sizing should also depend on where we are in the current market cycle. We’ll show you exactly how to do that in the next lesson!
Key Takeaways
Not all setups deserve equal position sizes. Count edges systematically and scale positions based on conviction level. Use minimum 2 edges for Phase 1 traders, allow 1-edge trades for experienced traders. Adapt edge weighting based on market cycles and track performance by edge count.
The scaling system:
- 0 edges = no trade
- 1 edge = 75% base
- 2 edges = 100% base
- 3 edges = 125% base
- 4+ edges = 150% base.
Always verify total risk stays within phase limits.
Next Action: Create your edge identification checklist this week. Score your last 10 trades using the system and compare results by edge count. Start applying edge-based scaling to new trades, beginning conservatively with smaller scaling ranges until you build confidence in the system.