The Question That Will Humble You
Another question for you: Here’s a question that will humble you: What’s your batting average from your last 50 trades?
Don’t know? What about your average gain vs average loss?
Still don’t know?
Then you’re trading completely blind, and you have no business risking more than 0.5% per trade until you know your stats.
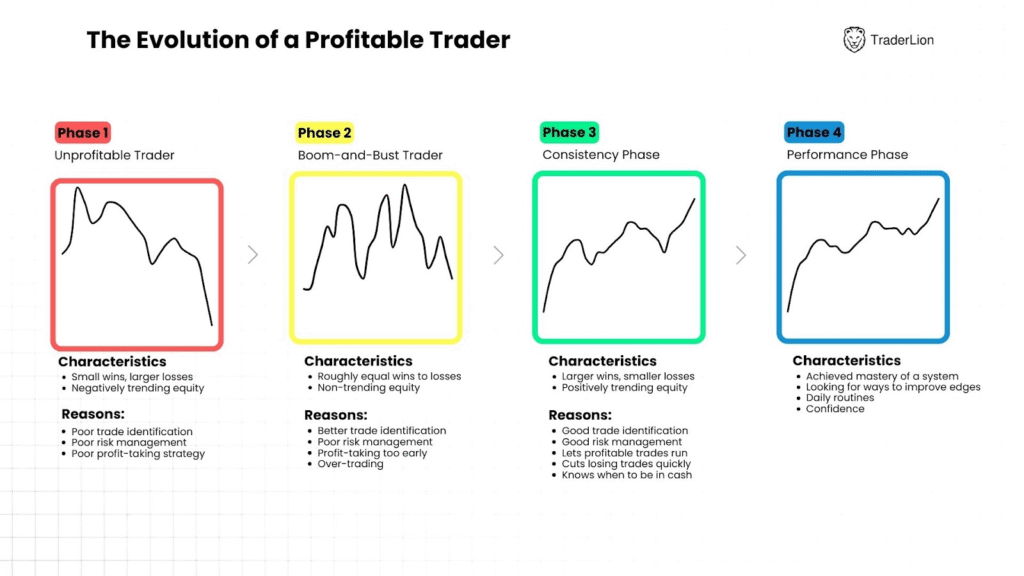
This is one of the main issues we see Phase 1 and Phase 2 traders struggle with — they spend months or even years learning chart patterns and different strategies, but never spend a single hour calculating the numbers that actually determine their success.
This backwards approach is exactly why 90% of traders fail.
Meet Van Tharp: The Position Sizing Master
Dr. Van K. Tharp was a Ph.D. psychologist who spent over 40 years researching what separates winning traders from losers. He founded the Van Tharp Institute and was the only trading coach featured in Jack Schwager’s legendary “Market Wizards.”

Here’s what made Tharp different: He proved mathematically that position sizing accounts for 60% of your trading success.
Think about that. Not stock picking. Not market timing. Not technical analysis. Position sizing.
His key quote for beginner traders: “Never risk more than 1% of total equity on any trade. Risking more than 3% is usually financial suicide, and the average trader commits financial suicide all the time without knowing it.”
The Critical Distinction Most Traders Miss
Before we dive into examples, you need to understand the difference between account risk and trade risk. Most traders confuse these and blow up their accounts.
Account Risk: How much of your total account you’re willing to lose on a single trade
Trade Risk: How far the stock can move against you before hitting your stop loss
These are completely different numbers, and both play a huge part in Van Tharp’s position sizing method.
Account Risk By Trading Phase
Based on your current phase, here’s a quick guide to determining your maximum account risk per trade:

• Phase 1: 0.25% maximum account risk
• Phase 2: 0.5% maximum account risk
• Phase 3+: Up to 1-2% maximum account risk
So let’s say you’re a Phase 2 trader with a $100,000 account. You’re willing to risk 0.5% of the account per trade. Here’s the math:
- $100,000 account
- 0.5% risk per trade = $500 at risk per trade
It seems simple, but so many people skip this step and then end up having no consistent way to position size. You MUST determine how much you’re willing to risk per trade!
Van Tharp’s Position Sizing Formula
Here’s the exact formula that fixes this confusion:
Position Size = Account Risk ÷ Trade Risk Per Share
Using our PLTR example: • Account Risk: $250 (Phase 2 trader) • Trade Risk Per Share: $1.50 • Position Size: $250 ÷ $1.50 = 166 shares
This formula works regardless of whether the stock has a 3% stop or 8% stop. Your account risk stays constant, position size adjusts automatically.
Real Example: PLTR Trade Breakdown
Let’s use a real trade to show how account risk and trade risk work together. Remember the PLTR example from our last lesson? Here’s how different traders would size that same trade:
Setup: PLTR breaks out at $25, logical stop at $23.50 (6% trade risk)
Phase 1 Trader – $25,000 Account
• Account Risk: 0.25% = $62.50 maximum loss
• Trade Risk: $1.50 per share ($25 – $23.50)
• Position Size: $62.50 ÷ $1.50 = 41 shares
• Total Position Value: $1,025 (4% of account)
Phase 2 Trader – $50,000 Account
• Account Risk: 0.5% = $250 maximum loss
• Trade Risk: $1.50 per share
• Position Size: $250 ÷ $1.50 = 166 shares
• Total Position Value: $4,150 (8.3% of account)
Phase 3 Trader – $100,000 Account
• Account Risk: 1.5% = $1,500 maximum loss
• Trade Risk: $1.50 per share
• Position Size: $1,500 ÷ $1.50 = 1,000 shares
• Total Position Value: $25,000 (25% of account)
Notice how the trade risk stays the same (6% stop distance) but the position sizes vary dramatically based on account risk tolerance and account size.
Why This Distinction Matters
Without understanding this difference, traders make fatal mistakes:
Mistake 1: “I’ll risk 5% on this trade” – they think this means 5% account risk, but they’re actually talking about trade risk. They end up risking way too much.
Mistake 2: They see a 3% stop distance and think “that’s too small” so they ignore logical chart levels and use arbitrary wider stops.
Mistake 3: They work backwards from desired position size instead of forward from logical risk management.
The Three Numbers You Must Track
Van Tharp identified the three statistics that determine your success:
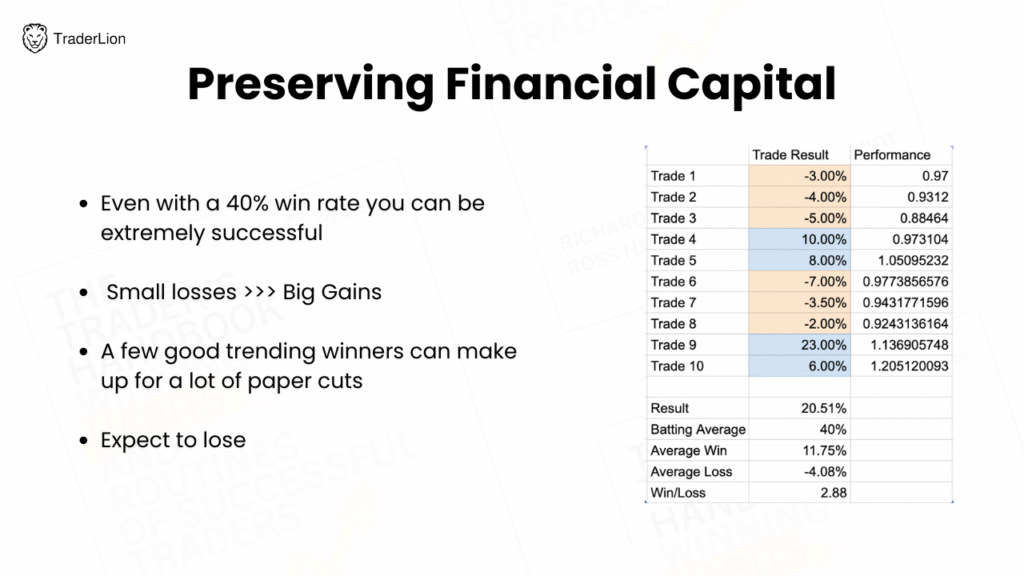
1. Batting Average (Win Rate)
Formula: (Winning trades ÷ Total trades) × 100 Reality: Most profitable traders win 35-60% of the time
Here’s a visual on how a 40% batting average over 10 trades results in a 20% account gain…

2. Average Gain
Formula: Sum of all winning percentages ÷ Number of wins
Target: Should be 2-3x your average loss
3. Average Loss
Formula: Sum of all losing percentages ÷ Number of losses
Target: Keep this consistent through proper stop discipline
These numbers determine everything about your position sizing strategy.
Why Small Account Risk Creates Big Returns
This is where most traders get it wrong. They think small risk percentages are meaningless, but the math proves otherwise.
Example: $25,000 Account, 0.5% Risk Per Trade
Month 1: 20 trades, 45% win rate, 2.5R average winners
Result: +$562 (2.25% monthly gain) New Balance: $25,562
Month 6: Same performance
Account: $29,200 (17% gain)
Month 12: Same performance
Account: $34,100 (36% annual return)
The secret isn’t big position sizes – it’s consistent execution with proper risk management.
Stop Loss Reality Check
Van Tharp advocated mathematical stops, but we use chart-based logic:
Logical Stop Placement:
• Below key support levels
• Below the low of your entry day
• Below moving average support
• Below the pattern low
Never use arbitrary stops. The stock doesn’t care that you want a 4% stop loss. It only respects actual support and resistance levels.
Your stop placement determines your trade risk, which determines your position size.
What’s Coming Next
The next lesson covers progressive exposure – how Mark Minervini scales positions based on market feedback. You’ll see exactly how he builds from pilot positions to full size using the foundation we just established.
But first, you need to get your tracking system set up and start measuring your actual performance. Without knowing your numbers, advanced techniques won’t help you.
Key Takeaways
Van Tharp proved position sizing determines 60% of trading success. Account risk and trade risk are different – never confuse them.
Use the formula: Account Risk ÷ Trade Risk Per Share = Position Size.
Track your batting average, average gain, and average loss religiously.
Small risk percentages compound into large returns through consistent execution. Logical chart-based stops determine trade risk, not arbitrary percentages.
Next Action: Set up your tracking spreadsheet this week. Input your last 10 trades if available and calculate your current statistics. Determine your honest trading phase and commit to the appropriate account risk percentage. Start applying the position sizing formula to every new trade.