First Things First: What Phase Are You Really?
Before we dive into numbers, we need to address the elephant in the room. In Lesson 1, you completed the Phase Assessment. But here’s what we’ve learned as a team from working with thousands of traders:
90% of people lie to themselves about their phase.
They look at the years they’ve been “trading” and automatically put themselves in Phase 2 or 3. But years don’t equal experience if those years were spent losing money.
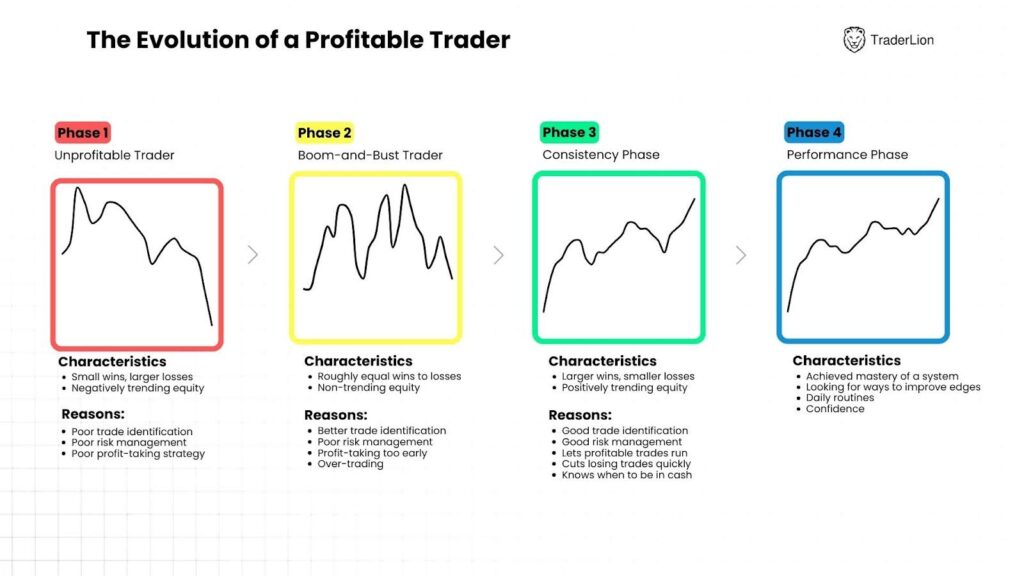
Let’s be brutally honest about what each phase actually means:
Phase 1: The Unprofitable Trader (Most Traders)
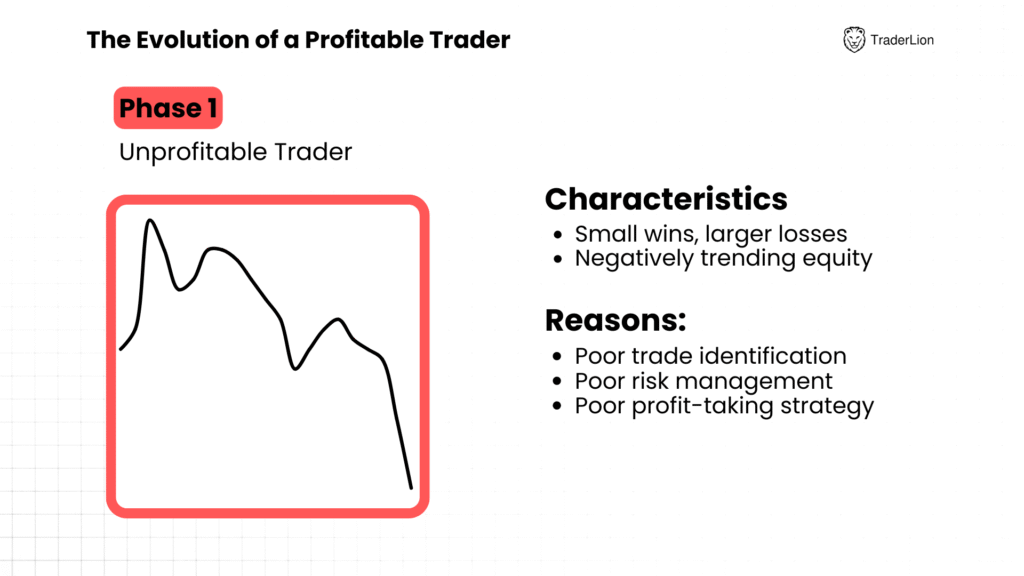
Reality Check: If any of these describe you, you’re Phase 1:
- Your account is smaller today than it was 2 years ago
- You can’t tell me your exact win rate from your last 50 trades
- You’ve blown up an account (or come close) in the past 3 years
The Hard Truth: Most traders stay in Phase 1 for 5-10 years because they keep making Phase 3 position sizing decisions with Phase 1 habits.
Easy way to blow up…
Phase 2: The Boom-and-Bust Trader
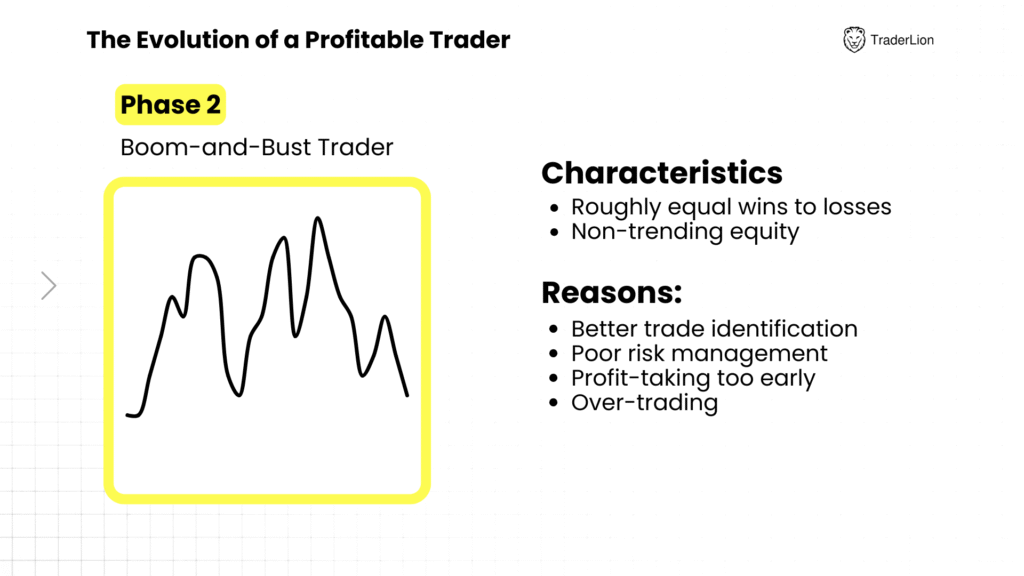
Reality Check: You’re only Phase 2 if:
- You’ve been consistently profitable for at least 18 months
- You have detailed records of 200+ trades
- You’ve survived at least one major market correction without blowing up
Seems pretty simple but very few people actually have 200+ annotated trades.
And when they do, they start making money… crazy coincidence 😉
Phase 3: The Consistency Phase
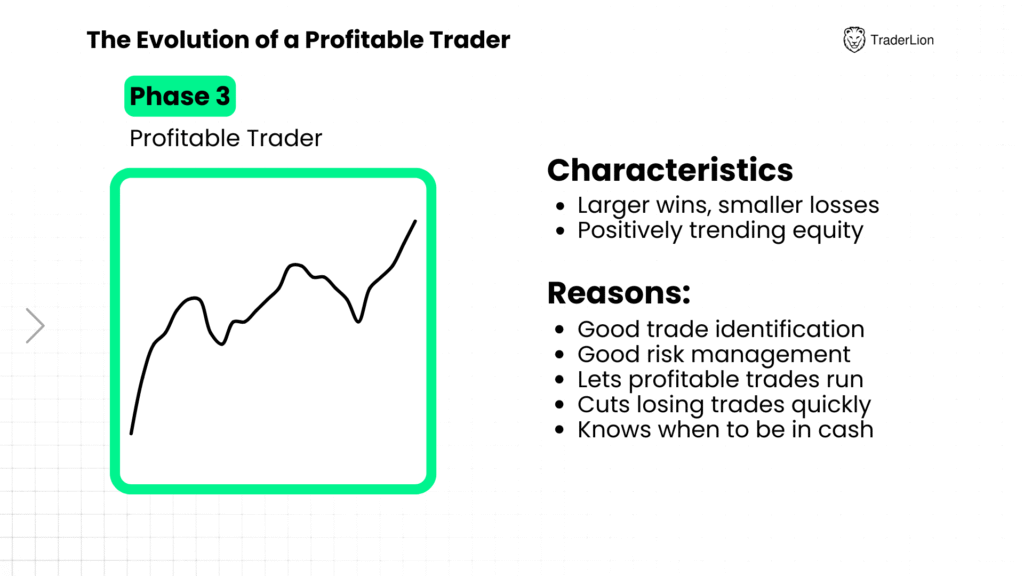
Reality Check: You’ve earned this phase only if:
- You’ve been consistently profitable for 3+ years across different market conditions
- Your worst month was less than 10% down
- You can articulate your strategy to someone else within 10 minutes
The plan here is clear:
- You can define your strategy simply
- You have confidence that it works in different market conditions
- Most importantly, you know you’ll never blow up from here
Phase 4: The Performance Phase
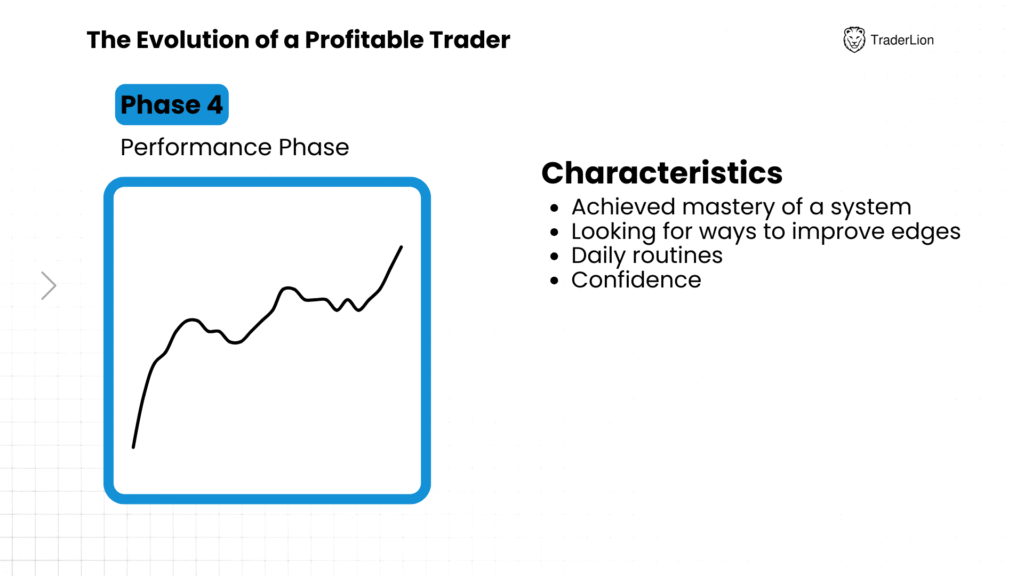
Reality Check: The elite level where you’ve achieved system mastery and focus on optimization rather than survival.
The Hard Truth: Less than 5% of traders ever reach Phase 3, and less than 1% reach Phase 4.
So with the phases in mind, and a clear outline as to which one YOU are, let’s focus on the 5 numbers that determine your trading success from where you currently are:
The 5 Numbers That Determine Your Success
These five metrics tell you everything:
1. Win Rate (Batting Average)
- Formula: (Number of winning trades ÷ Total trades) × 100
- Profitable traders have win rates between 35-60%. You don’t need to be right most of the time to make money.
2. Average Gain vs Average Loss Ratio
- Formula: Average winning trade percentage ÷ Average losing trade percentage
- The Magic Number: Profitable traders maintain at least a 1.5:1 ratio.
- This means that if your average loser over the last 10 losing trades was 5%, your average winner over the last 10 winners is 7.5%.
3. Risk Per Trade
Phase-Based Rules:
- Phase 1: Maximum 0.5% of account per trade
- Phase 2: Maximum 1% of account per trade
- Phase 3: Maximum 2% of account per trade
- Phase 4: Up to 2.5% of account per trade (earned privilege)
It may sound silly to you to only risk 0.5% of your account on a trade, but if you know how to find tight, logical stops, this is all you really need to make money.
Remember, the rules above are a guideline, not a requirement. So if you can find ways to RISK LESS with MORE UPSIDE, meaning the setup is that good, do it!
We’ll cover more on how to do that in a later lesson.
4. Maximum Drawdown
- Formula: (Peak account value – Lowest subsequent value) ÷ Peak account value × 100
Warning Signs:
- Phase 1: Multiple drawdowns exceeding 20% indicate oversizing
- Phase 2: Multiple exceeding 15% suggest poor risk management
- Phase 3: Multiple drawdowns exceeding 12% mean you’re taking too much risk
- Phase 4: Multiple drawdowns exceeding 10% indicate emotional trading
5. Profit Factor
- Formula: Sum of all winning trades ÷ Sum of all losing trades
Benchmarks:
- Below 1.0: You’re losing money
- 1.25-2.0: Solid performance
- Above 2.0: Excellent
The Math That Separates Winners from Losers
Scenario 1: The “Good” Stock Picker
- Win Rate: 70%
- Average Gain: 5%
- Average Loss: 15%
- Result: -1% expected return per trade (loses money)
Scenario 2: The Disciplined Trader
- Win Rate: 45%
- Average Gain: 12%
- Average Loss: 4%
- Result: +3.2% expected return per trade (makes money)
This mathematical reality separates winners from losers — and again, you don’t have to be the type of trader with an 80% win rate to make it. In fact, these traders are very rare.
All you have to do is make sure that on average, your winners outpace your losers by about 2. Add this up over 1000 trades and you’ll be super pleased with the results.
Your Phase-Based Action Plan
Phase 1 Traders (Unprofitable)
Maximum Position Size: 8-10% of account
Maximum Risk Per Trade: 0.5% of account
Target Metrics:
- Win Rate: Focus on 40%+
- Gain/Loss Ratio: Minimum 1.5:1
- Maximum Drawdown: Under 15%
Phase 2 Traders (Boom-and-Bust)
Maximum Position Size: 12-15% of account
Maximum Risk Per Trade: 1% of account
Target Metrics:
- Win Rate: 40-50% range
- Gain/Loss Ratio: Minimum 2:1
- Maximum Drawdown: Under 12%
Phase 3 Traders (Consistency Phase)
Maximum Position Size: 20-25% of account
Maximum Risk Per Trade: Up to 2% of account
Target Metrics:
- Win Rate: 45-60% range
- Gain/Loss Ratio: 2.5:1 or better
- Maximum Drawdown: Under 10%
Phase 4 Traders (Performance Phase)
Maximum Position Size: 25-30% of account
Maximum Risk Per Trade: Up to 2.5% of account
Target Metrics:
- Win Rate: 50-65% range
- Gain/Loss Ratio: 3:1 or better
- Maximum Drawdown: Under 8%
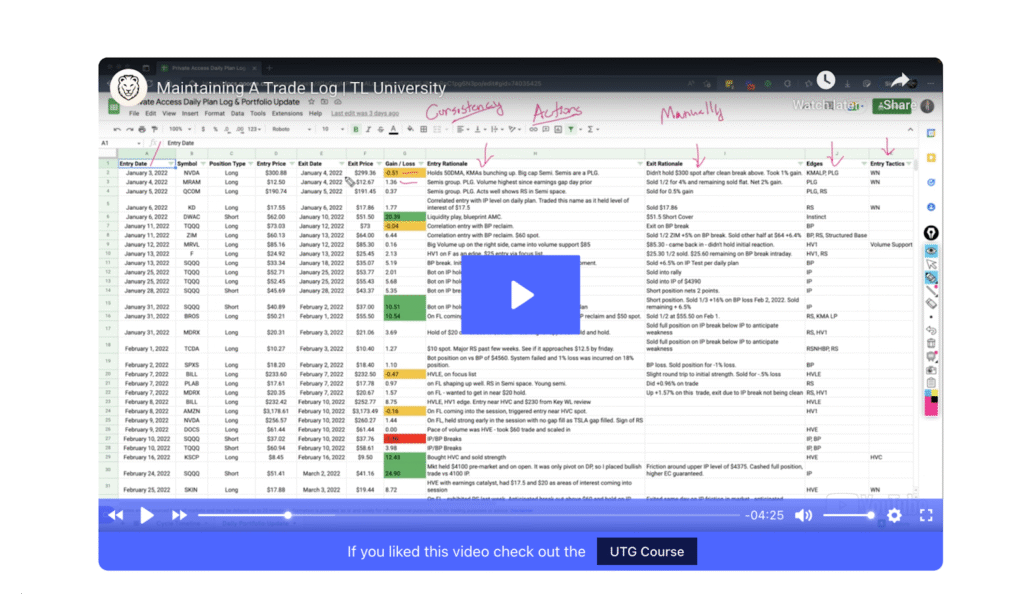
Setting Up Your Tracking System
Required Columns:
- Date – When you entered the trade
- Symbol – Stock ticker
- Entry Price – Your buy price
- Entry Rationale – Why you entered
- Exit Price – Your sell price
- Exit Rationale – Why you exited
- Edges – What pattern / setup did you see?
- Entry Tactics – What repeatable entry tactic did you use
- Gain/Loss (%) – Percentage gain or loss
- Risk ($) – Maximum you were willing to lose
- Risk (%) – Risk as percentage of account
The Only Formulas You Need:
- Win Rate = Winning Trades ÷ Total Trades
- Average Gain = Sum of All Winning Percentages ÷ Number of Wins
- Average Loss = Sum of All Losing Percentages ÷ Number of Losses
- Profit Factor = Total Gains ($) ÷ Total Losses ($)
Check out this video as well:
The Compound Power of Small Improvements
Example: $30,000 Account, 24 Trades Per Year
Before Tracking (Typical Phase 1):
- Win Rate: 45%, Average Gain: 6%, Average Loss: 8%
- Position Size: 15% (too large for phase)
- Annual Return: -12% (losing money)
After 6 Months of Disciplined Tracking:
- Win Rate: 50%, Average Gain: 8%, Average Loss: 4%
- Position Size: 10% (appropriate for phase)
- Annual Return: +28% (profitable)
Small improvements in metrics create massive performance differences.
Universal Standards
Healthy Metrics for All Phases:
- Win Rate: 35-60%
- Gain/Loss Ratio: Minimum 1.5:1, target 2:1+
- Risk Per Trade: Never exceed phase maximums
- Profit Factor: Above 1.25 for sustainable profitability
Universal Red Lines:
- No single trade risking more than 3% of account
- No position larger than 25% of account (until Phase 3+)
- No month with more than 5% account drawdown
What’s Coming in Lesson 3
Next lesson covers Progressive Exposure — how professional traders scale position sizes based on market feedback and winning streaks.
Reality Check: If you don’t set up tracking this week, you’re not serious about trading success. The math doesn’t lie, but you have to measure it first.
Key Takeaways
- Five metrics determine success more than stock picking
- Phase-based limits prevent account destruction
- Small improvements in metrics = massive performance gains
- Tracking reveals patterns your ego won’t admit
- Consistency matters more than perfection
Next Action: Set up the basic tracking spreadsheet and input your last 10 trades. These numbers will guide every position sizing decision going forward.