The Market Cycle is simple:
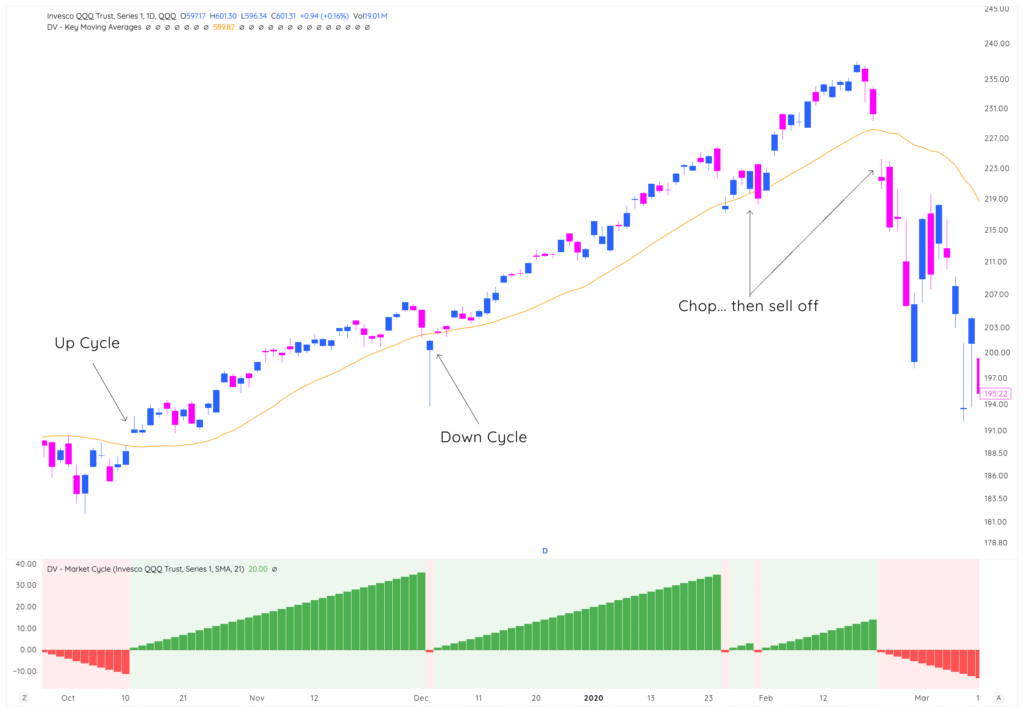
Add the 21-day to your charts. Look for when price is above/below — and then adjust your trading to match the direction of the cycle…
But there’s another step you can take to really make the Market Cycle System an edge for your trading:
Knowing WHERE you are within each cycle. What we mean is this – Day 3 of an up cycle is completely different from Day 18. And when we say “different”, here’s a little bit of what we mean:
- Early up cycles are much more powerful than late up cycles
- Stress tests (pullbacks) occur regularly throughout each cycle — by studying, you can almost “predict” them
- The action after a stress test will tell you if you can get aggressive again
Let’s keep moving…
What you shouldn’t do: treat all up cycle days the same
Here’s what we see all the time:
A trader learns that SPX is above its 21-day SMA, so they think “green light, time to buy!” They put on the same exposure whether it’s Day 2 or Day 17 of the cycle.
This is one of the worst things you can do — the beginning of a trend should be traded completely differently than the latter part of a trend.
What you should do instead:
- Identify key early uptrend days (Days 1-3 are critical for timing)
- Recognize stress test periods (Days 4-7 when cycles prove themselves)
- Re-assess your approach from there
- Key idea: Market cycles usually move in 2-4 or 3-5 day sprints
This is an example of perfect action coming out of a down cycle into an up cycle:
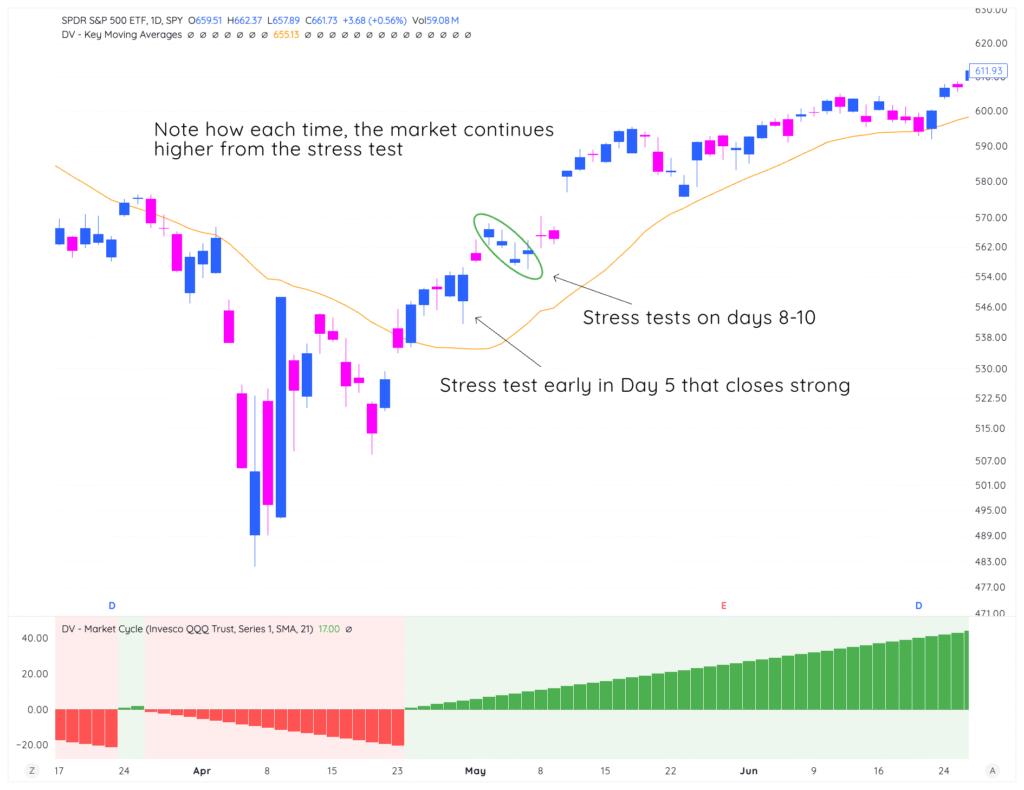
Imagine you didn’t get long at the start of the up cycle, and then waited for days 5-7 to show you “confirmation”.
You likely would have gotten stopped out or felt a ton of portfolio pressure on these days as the market pulled in – and maybe you would’ve sold near lows, just for price to gap up an continue higher on the days following.
The point is you can completely avoid this type of trading by studying Market Cycles and their patterns, more of which we’ll get into right now:
The Four Predictable Phases of Every Cycle
Phase 1: Early Cycle (Days 1-3)
This is where everything begins. The market (SPY, QQQ, IWM, SPX, NQ, anything you decide) has just closed back above its 21-day SMA after being below it. But as you’ve seen before, not every breakout above the SMA leads to a sustained cycle.
Here are some characteristics to look for to gain confidence in a new up cycle lasting longer than a couple of sessions:
- Volume on the breakout day: You want to see above-average volume when SPX reclaims the SMA
- How clean the close is: A strong close near the high of the day is much better than barely closing above the average
- Breadth: Are most stocks participating, or is it just a few big names doing all the work?
- A Gap completely above the 21-day: We’ve seen this more and more recently — where a big gap up above the moving average catches traders off guard and leaves them without enough exposure to capitalize on a new trend.
Check out this period in 2023:
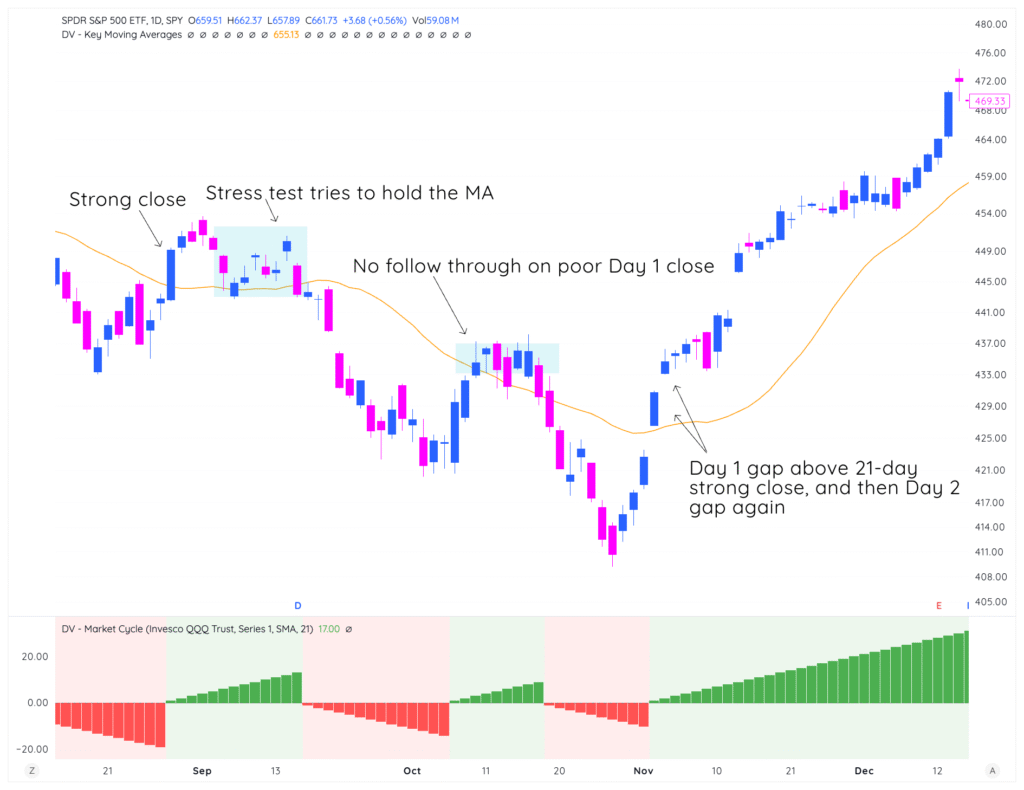
On the first try:
- Strong close on Day 1
- No real follow through on days 2-4
- Stress test day 5-7
- Attempted bounce off the 21-day, and then sell off
Second try:
- Not the strongest close on Day 1, and then no follow through after
- High likelihood this action fails
Third try:
- Day 1 gap above the 21-day
- Day 2 follow through gap
- Day 6-7, stress test
- Day 8 immediate gap up and go
The differences in this 3 month period are clear and are a great illustration of why you should be studying price action closely after a new up cycle begins (the same can be said for the start of a new down cycle if you’re a short-biased trader).
Phase 2: The Stress Test (Days 4-7)
Here’s what almost every trader experiences: You buy on Day 2 of a cycle, it works for a couple days, you start feeling confident, and then the market pulls back and tests your conviction.
Welcome to the stress test. It happens every single cycle — usually around days 4-7.
What’s Happening: Every new up cycle gets tested. The reason for the “pullback” or “stress test” doesn’t matter, we’re simply analyzing if price gets bought up on weakness or if demand never shows up.
Let’s look at this example from early 2019:
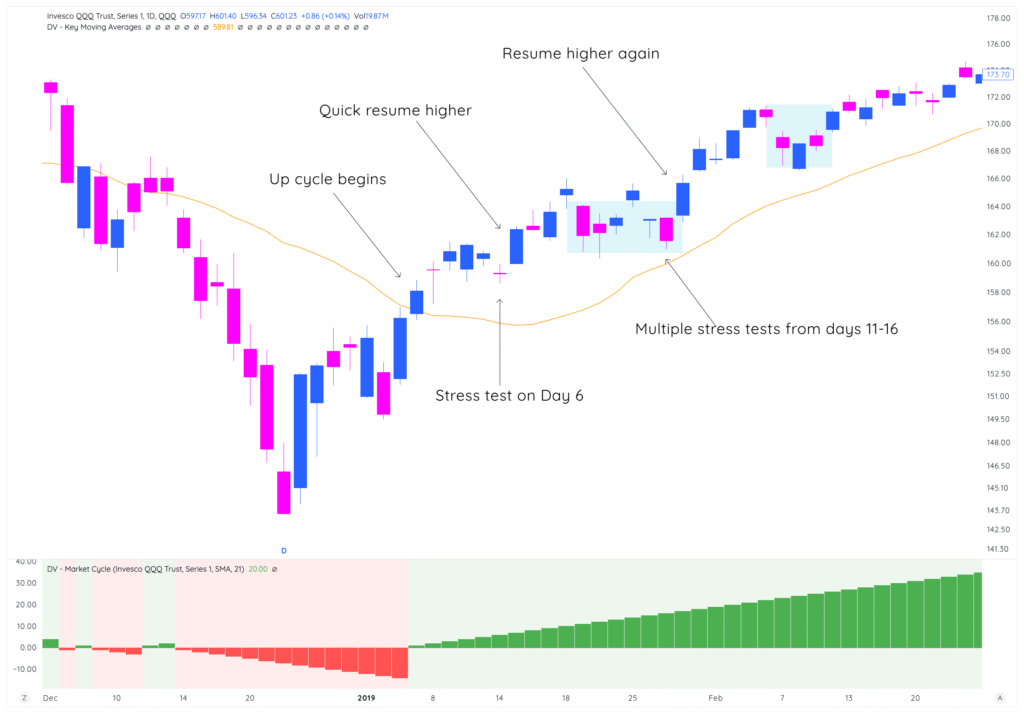
In this scenario, you can see that we reclaimed the 21-day SMA, and then on day 6, we get a day of selling, which is a stress test.
It’s likely that your portfolio is down this day, and any new positions you put on the day before are negative. Completely normal action – what matters afterwards is the reaction (which was positive, in the example above).
Here’s what happened after the Day 6 stress test:
- Price gapped up and closed strong on Day 7
- Moved higher until Day 11
- Day 11 was a gap down, and then sideways action for 4-5 more sessions
The days 11-15 is likely where you felt the most portfolio pressure, had to lighten up some names, just for the trend to resume higher.
This is completely normal… and takes us into the next phase of the Market Cycle System:
Phase 3: What Happens After Stress Tests
If the cycle survives its first and second stress tests, you enter the Phase 3. Often times, this is where your ability to sit and not micromanage your trades either makes you a ton of money, or leaves you scrambling trying to get positioned.
Staying with the example from above, this is exactly what happened:
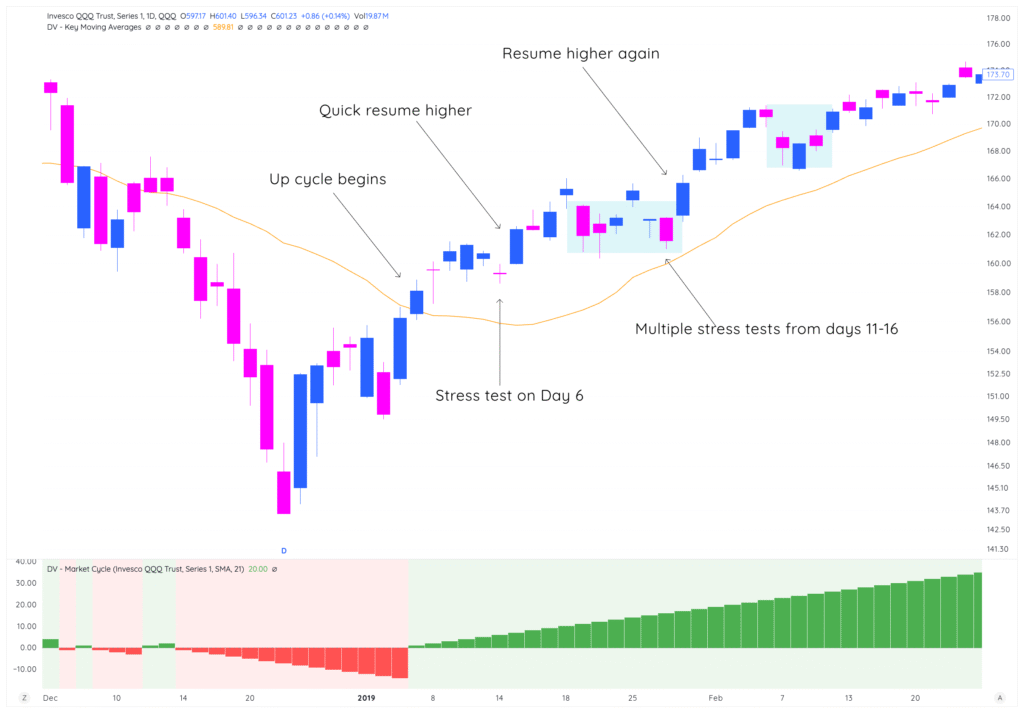
Characteristics your likely seeing after the market moves higher from a Stress Test:
- New breakouts work consistently: Stocks breaking out of bases actually follow through instead of failing
- Pullbacks are bought quickly: Any weakness gets absorbed by eager buyers
- Breadth expands: More stocks and sectors join the party, not just the early leaders
How to Capitalize:
- Add to your winning positions on any minor pullbacks
- Increase position sizes on new setups
- Look for secondary breakouts in stocks that were lagging initially
- Stay aggressive until you see signs of the next phase
Then, we move onto the last Phase of the Market Cycle:
Phase 4: Late Cycle (Days 20+) – “Warning Signs”
All good things must end. The longer a cycle runs, the higher the probability it’s getting ready to reverse. This doesn’t mean you should panic and sell everything, but it does mean you should start preparing and watching your stocks more closely.
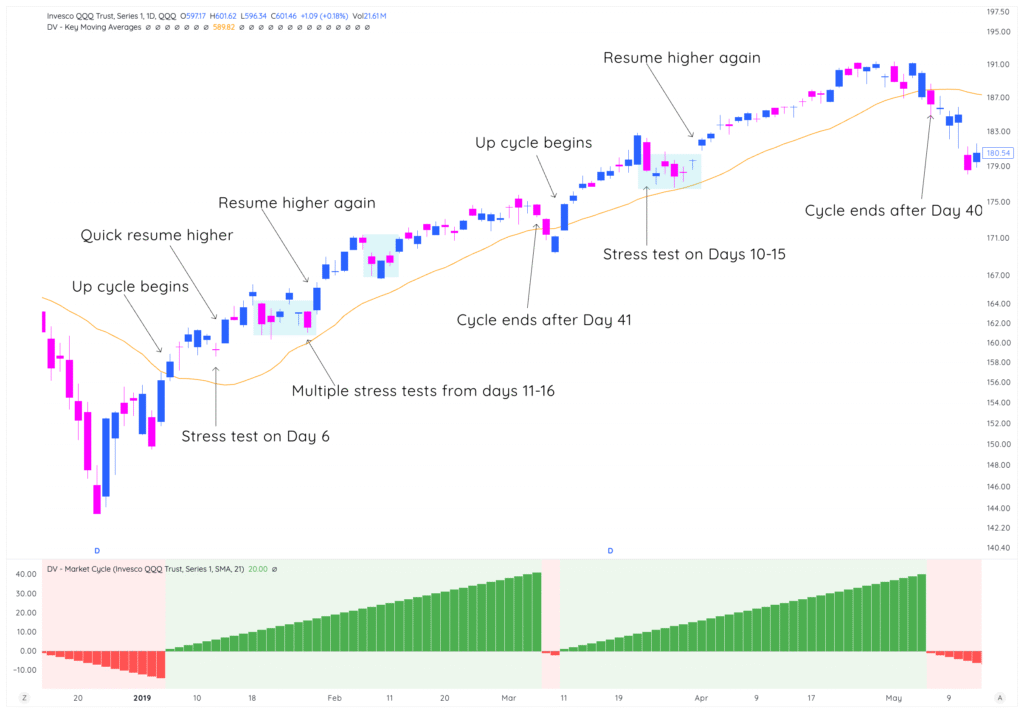
As you can see in the example above — both of our up cycles ended around Day 40. This is actually longer than normal (average up cycle length over the last 13 years on QQQ is 20 days), so you should have been riding positions that you established early in the trend, and taking quick swings towards the latter half of the cycle.
Here are some warning signs to keep track of near the end of a cycle:
- New breakouts start failing: Stocks break out but can’t follow through like they did in the sweet spot phase
- Volume decreases on rally attempts: Less conviction behind the moves up
- Only the strongest stocks still work: The market leadership narrows instead of broadening
- Market becomes more news-sensitive: Reacts more dramatically to headlines, both positive and negative
Your Approach:
- Take profits on your biggest winners
- Tighten stops on remaining positions
- Prepare for the next cycle by building a watchlist
- Avoid starting new positions unless they’re exceptional setups
The Key: Don’t try to squeeze every last point out of a cycle. The risk-reward starts favoring the sellers, and you want to be positioned accordingly.
How to Track Your Current Phase
We make this easy with the Deepvue market cycle indicator that you’ve seen referenced in all our charts. This tool automatically tracks:
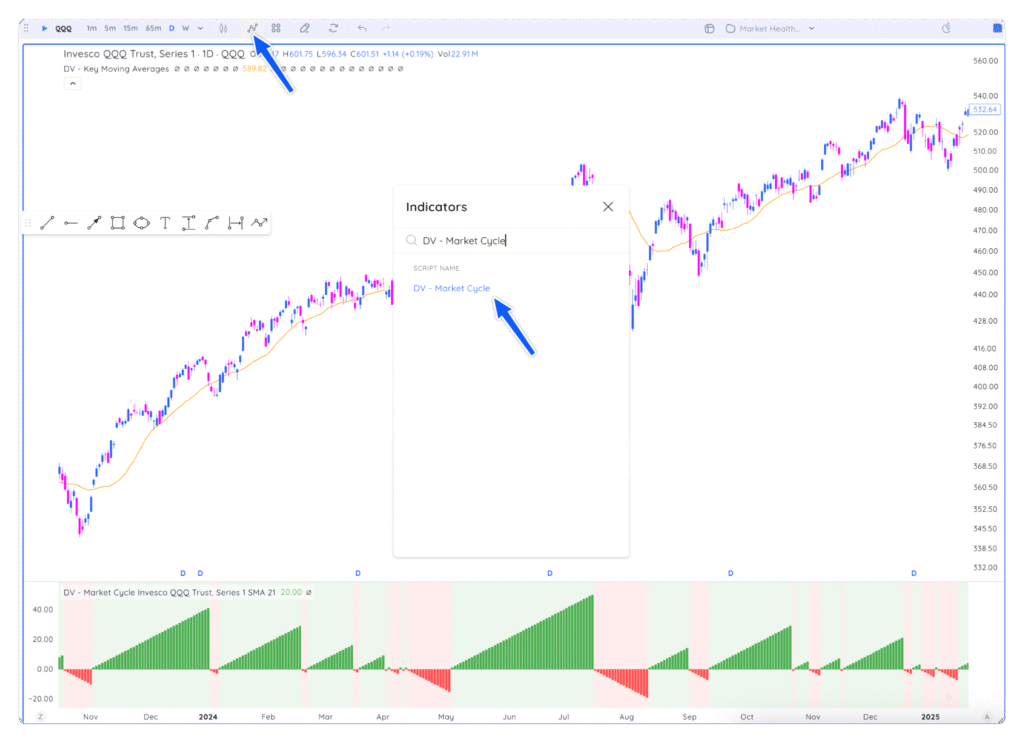
- Current cycle day
- Cycle length overall
- Visual of green/red to quickly know which cycle you’re in
To add it to your charts in Deepvue, all you have to do is search “DV – Market Cycle” in your indicators library!
Key Takeaways
- Every cycle follows this four-phase pattern
- Your strategy should change dramatically based on the phase
- The money is made by recognizing the phase, not predicting the future
- Day 2 of a cycle offers much better risk-reward than Day 17
- Understanding these patterns gives you a huge timing advantage over traders who treat all “up cycle” days the same
Most traders spend their time trying to predict where the market is going. Smart traders focus on understanding where the market IS and positioning accordingly.
Looking Forward
In our next lesson, we’ll dive into an important technical detail: 21-day SMA versus 21-day EMA and how to reduce cycle count noise.
You’ll learn why we sometimes get false signals and how to clean up your cycle reads for more reliable entries and exits. This fine-tuning can make the difference between a good system and a great one.
See you there!