Exhaustion Extension
Learn to recognize when a stock reaches unsustainable levels and master the art of locking in profits during euphoric price movements
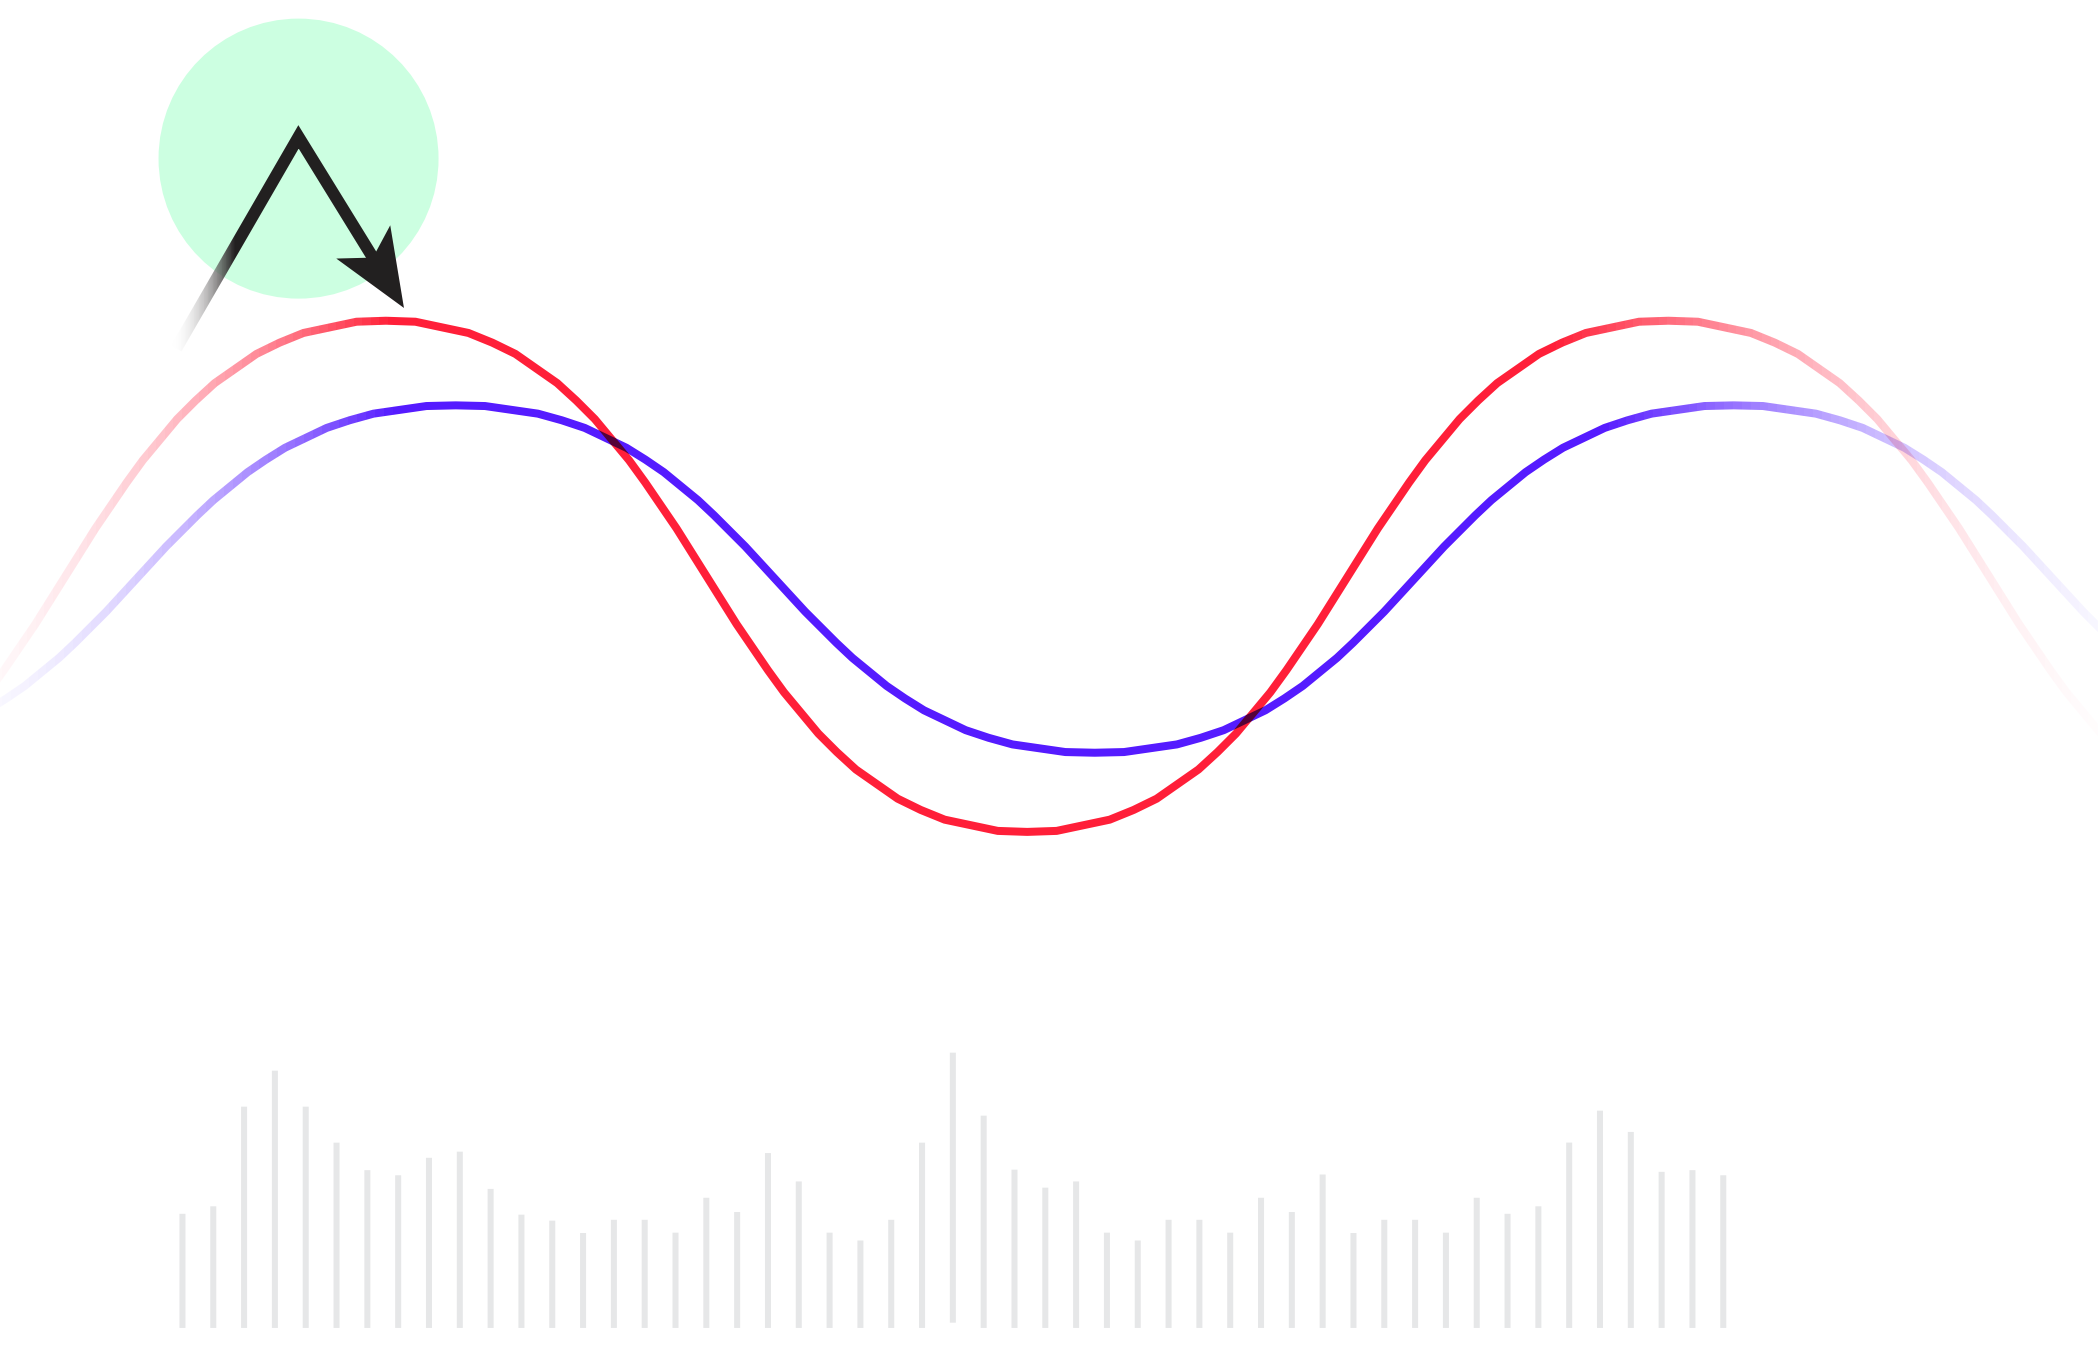
As a stock reaches the later stages of its Cycle of Price, it enters a period of heightened volatility and rapid price increases, often pushing the price far above its moving averages. This stage is known as the Exhaustion Extension—a signal that the uptrend is nearing its end. In this lesson, you’ll learn how to recognize an Exhaustion Extension, use it to lock in profits, and avoid getting caught in a sharp reversal.
Learning Objectives
By the end of this lesson, you will be able to:
- Identify an Exhaustion Extension as a signal of overextended price action
- Understand how to scale out of positions during euphoric price movements
- Use multiple time frames to confirm the Exhaustion Extension
- Recognize signs of weakness that follow Exhaustion Extensions
- Apply the Exhaustion Extension to individual stocks and market indices to manage risk
What is an Exhaustion Extension?

Defining the Exhaustion Extension
An Exhaustion Extension occurs when the price of a stock rapidly advances to unsustainable levels, far above the 10-day exponential moving average (EMA). This euphoric price movement reflects extreme greed in the market, often pushing the stock to new highs before sharply reversing lower.
Key Characteristics
- Euphoric Price Action: The price extends far above its moving averages, creating a gap or “air” between the stock and its 10-day EMA
- Increased Volatility: The stock moves erratically, with larger price swings and more frequent gaps as the uptrend loses momentum
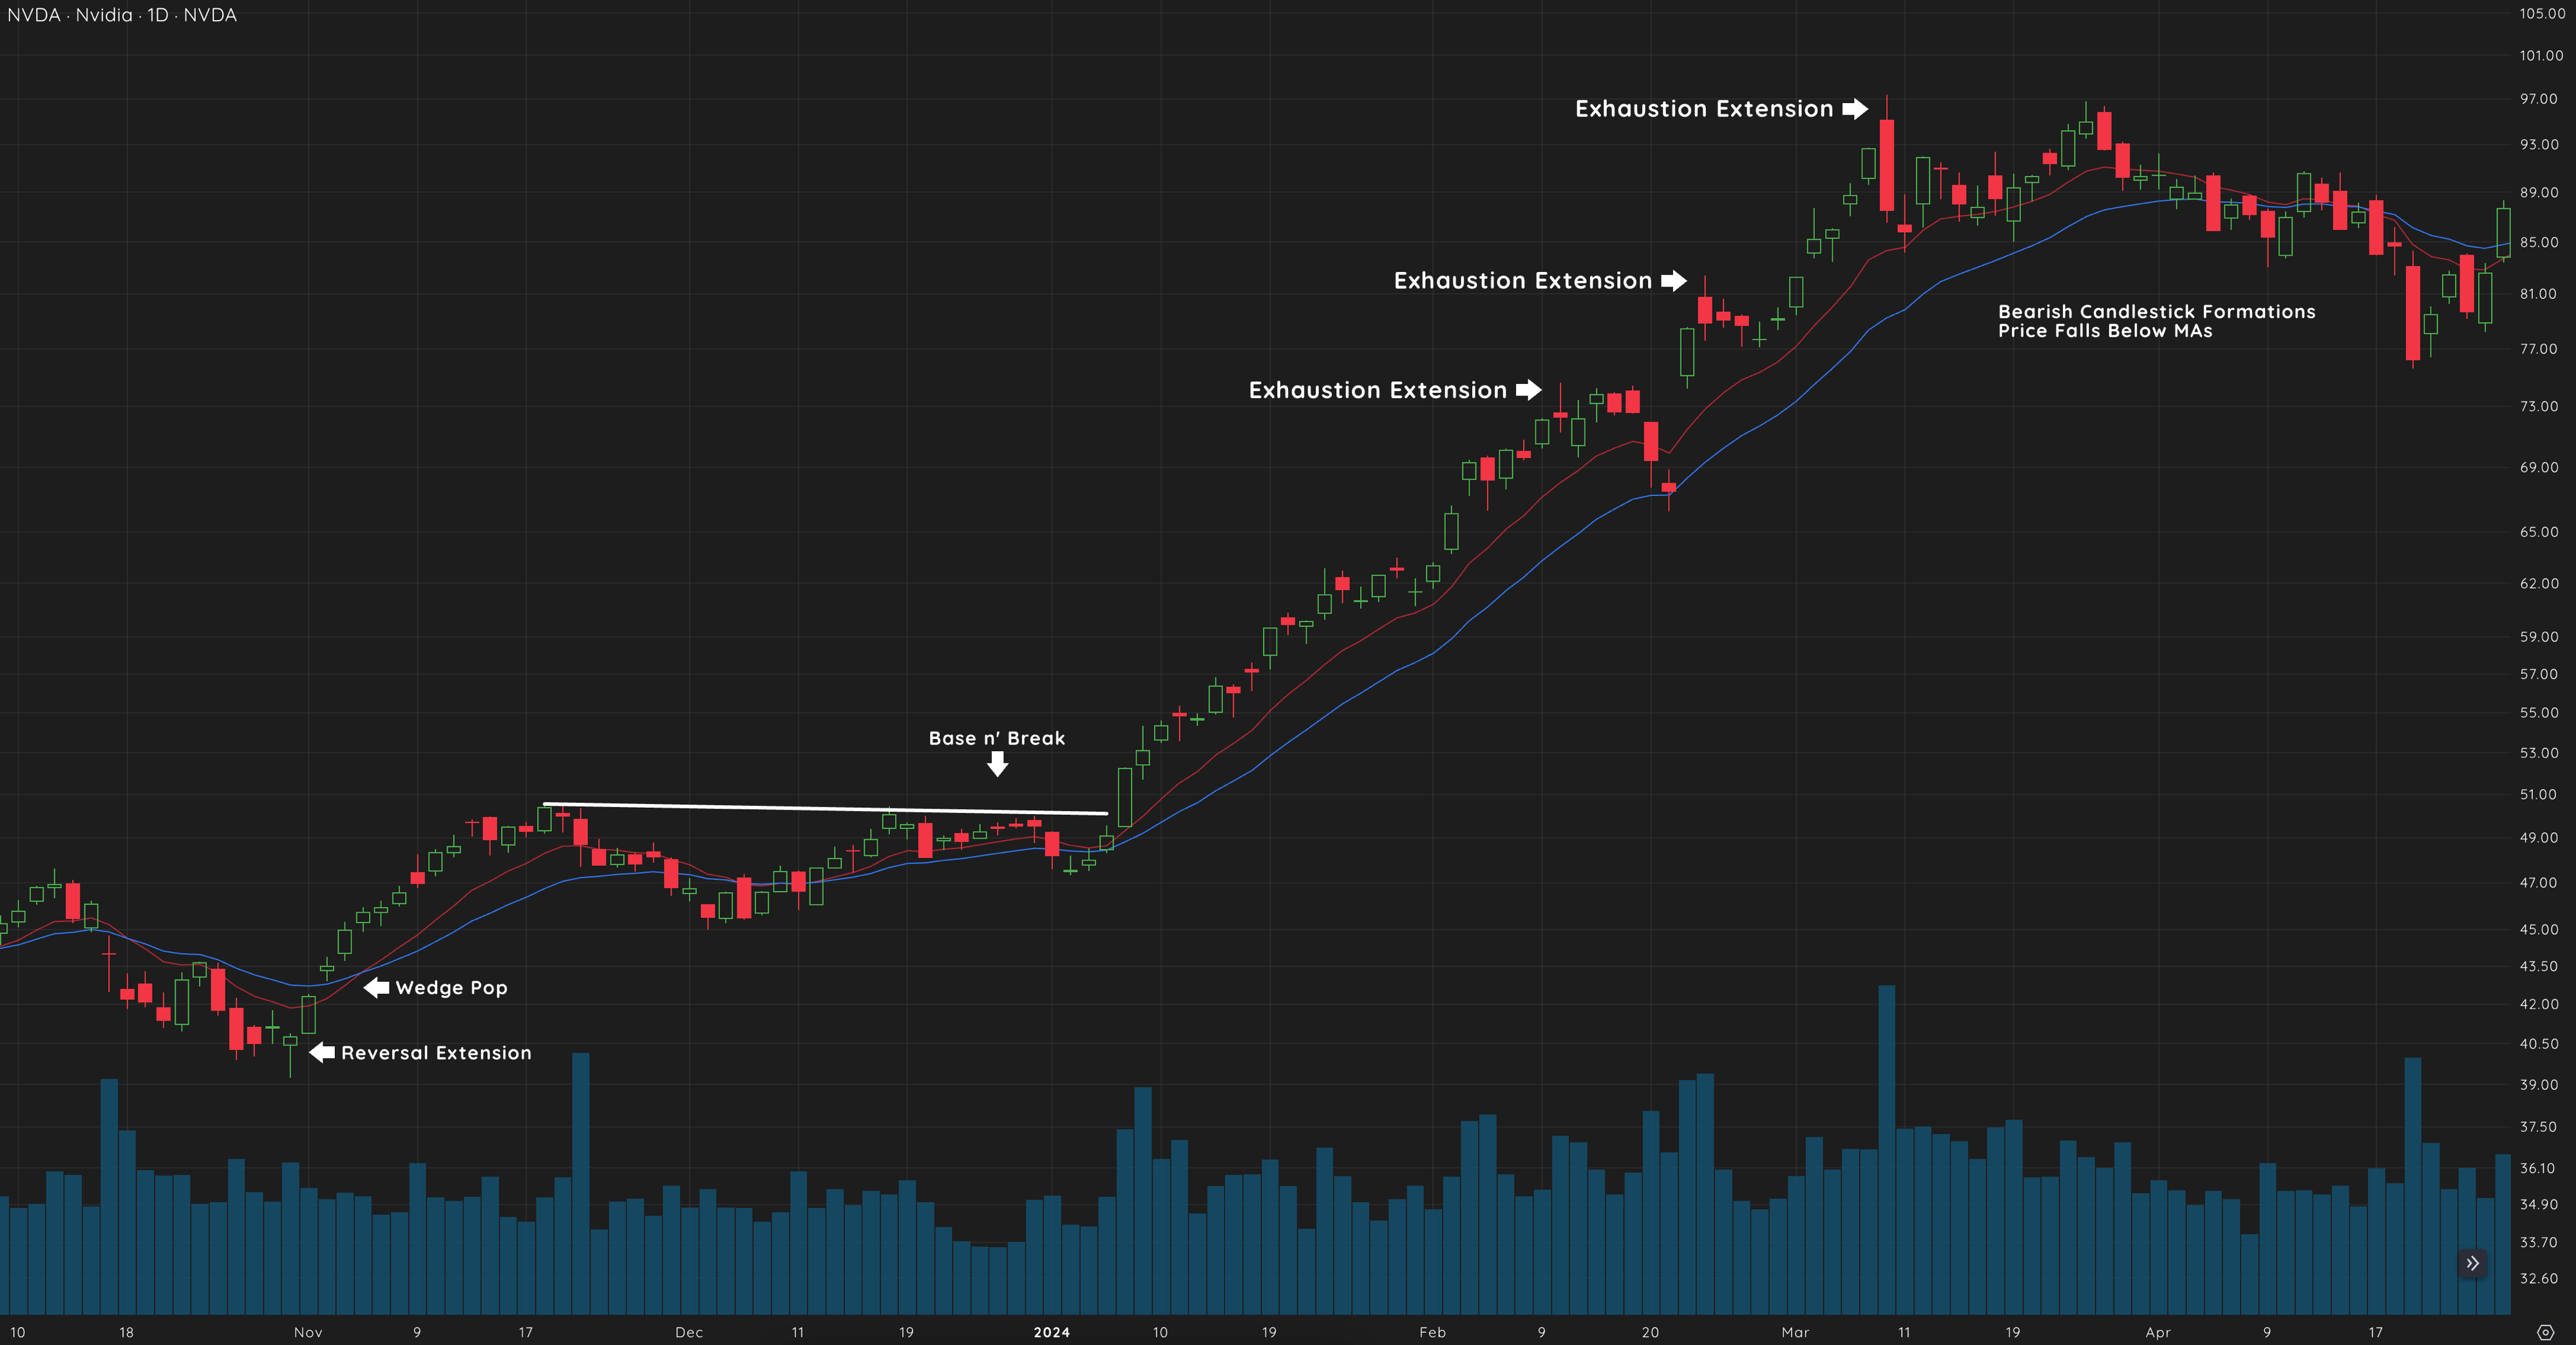
Example: NVDA 2024
In 2024, NVDA showed an Exhaustion Extension when its price surged well above the 10-day EMA before rapidly falling back to retest the moving averages.

Warning Signs of a Topping Formation
As the stock enters the Exhaustion Extension phase, additional warning signs may indicate that the uptrend is ending:
Warning Signals
- Increased Selling Volume: Volume spikes as sellers begin taking profits
- Bearish Candlestick Patterns: Patterns such as shooting stars or bearish engulfing candles signal potential reversals
- Gaps Down: The price may begin to gap down after failing to sustain its upward momentum
- Wedge Drop: After a consolidation, a Wedge Drop occurs, signaling the beginning of a new downtrend
Recognizing the Exhaustion Extension
Identifying Euphoric Price Action
As a stock becomes extended in its uptrend, watch for these signals that indicate an Exhaustion Extension:
Identification Signals
- Significant Distance from Moving Averages: When the price stretches far above the 10-day EMA, it suggests that the stock is overextended and due for a pullback
- Erratic Price Movement: Rapid price gains followed by increased volatility signal that the stock may be reaching a short-term top
Using Multiple Time Frames for Confirmation
To confirm an Exhaustion Extension, analyze the stock across multiple time frames:
Time Frame Analysis
- Daily and Weekly Charts: If the stock is extended on both the daily and weekly charts, the signal is stronger
- Shorter Time Frames: Use hourly or 15-minute charts to pinpoint the exact moment when the price begins to pull back or shows signs of weakness
Trading the Exhaustion Extension: Locking in Profits
Scaling Out Into Strength
One of the best ways to manage risk during an Exhaustion Extension is to scale out of your position as the stock reaches euphoric highs. This allows you to lock in profits while still giving the stock room to advance if the uptrend continues.
Profit Management Strategies
- Partial Selling: Sell a portion of your shares as the price extends far above the moving averages. This helps protect against a sharp reversal while giving you flexibility to stay in the trade if the stock continues higher
- Avoid Chasing: If the stock has already made a large, unsustainable move, avoid buying more at these elevated levels. Instead, wait for a pullback or new base to form
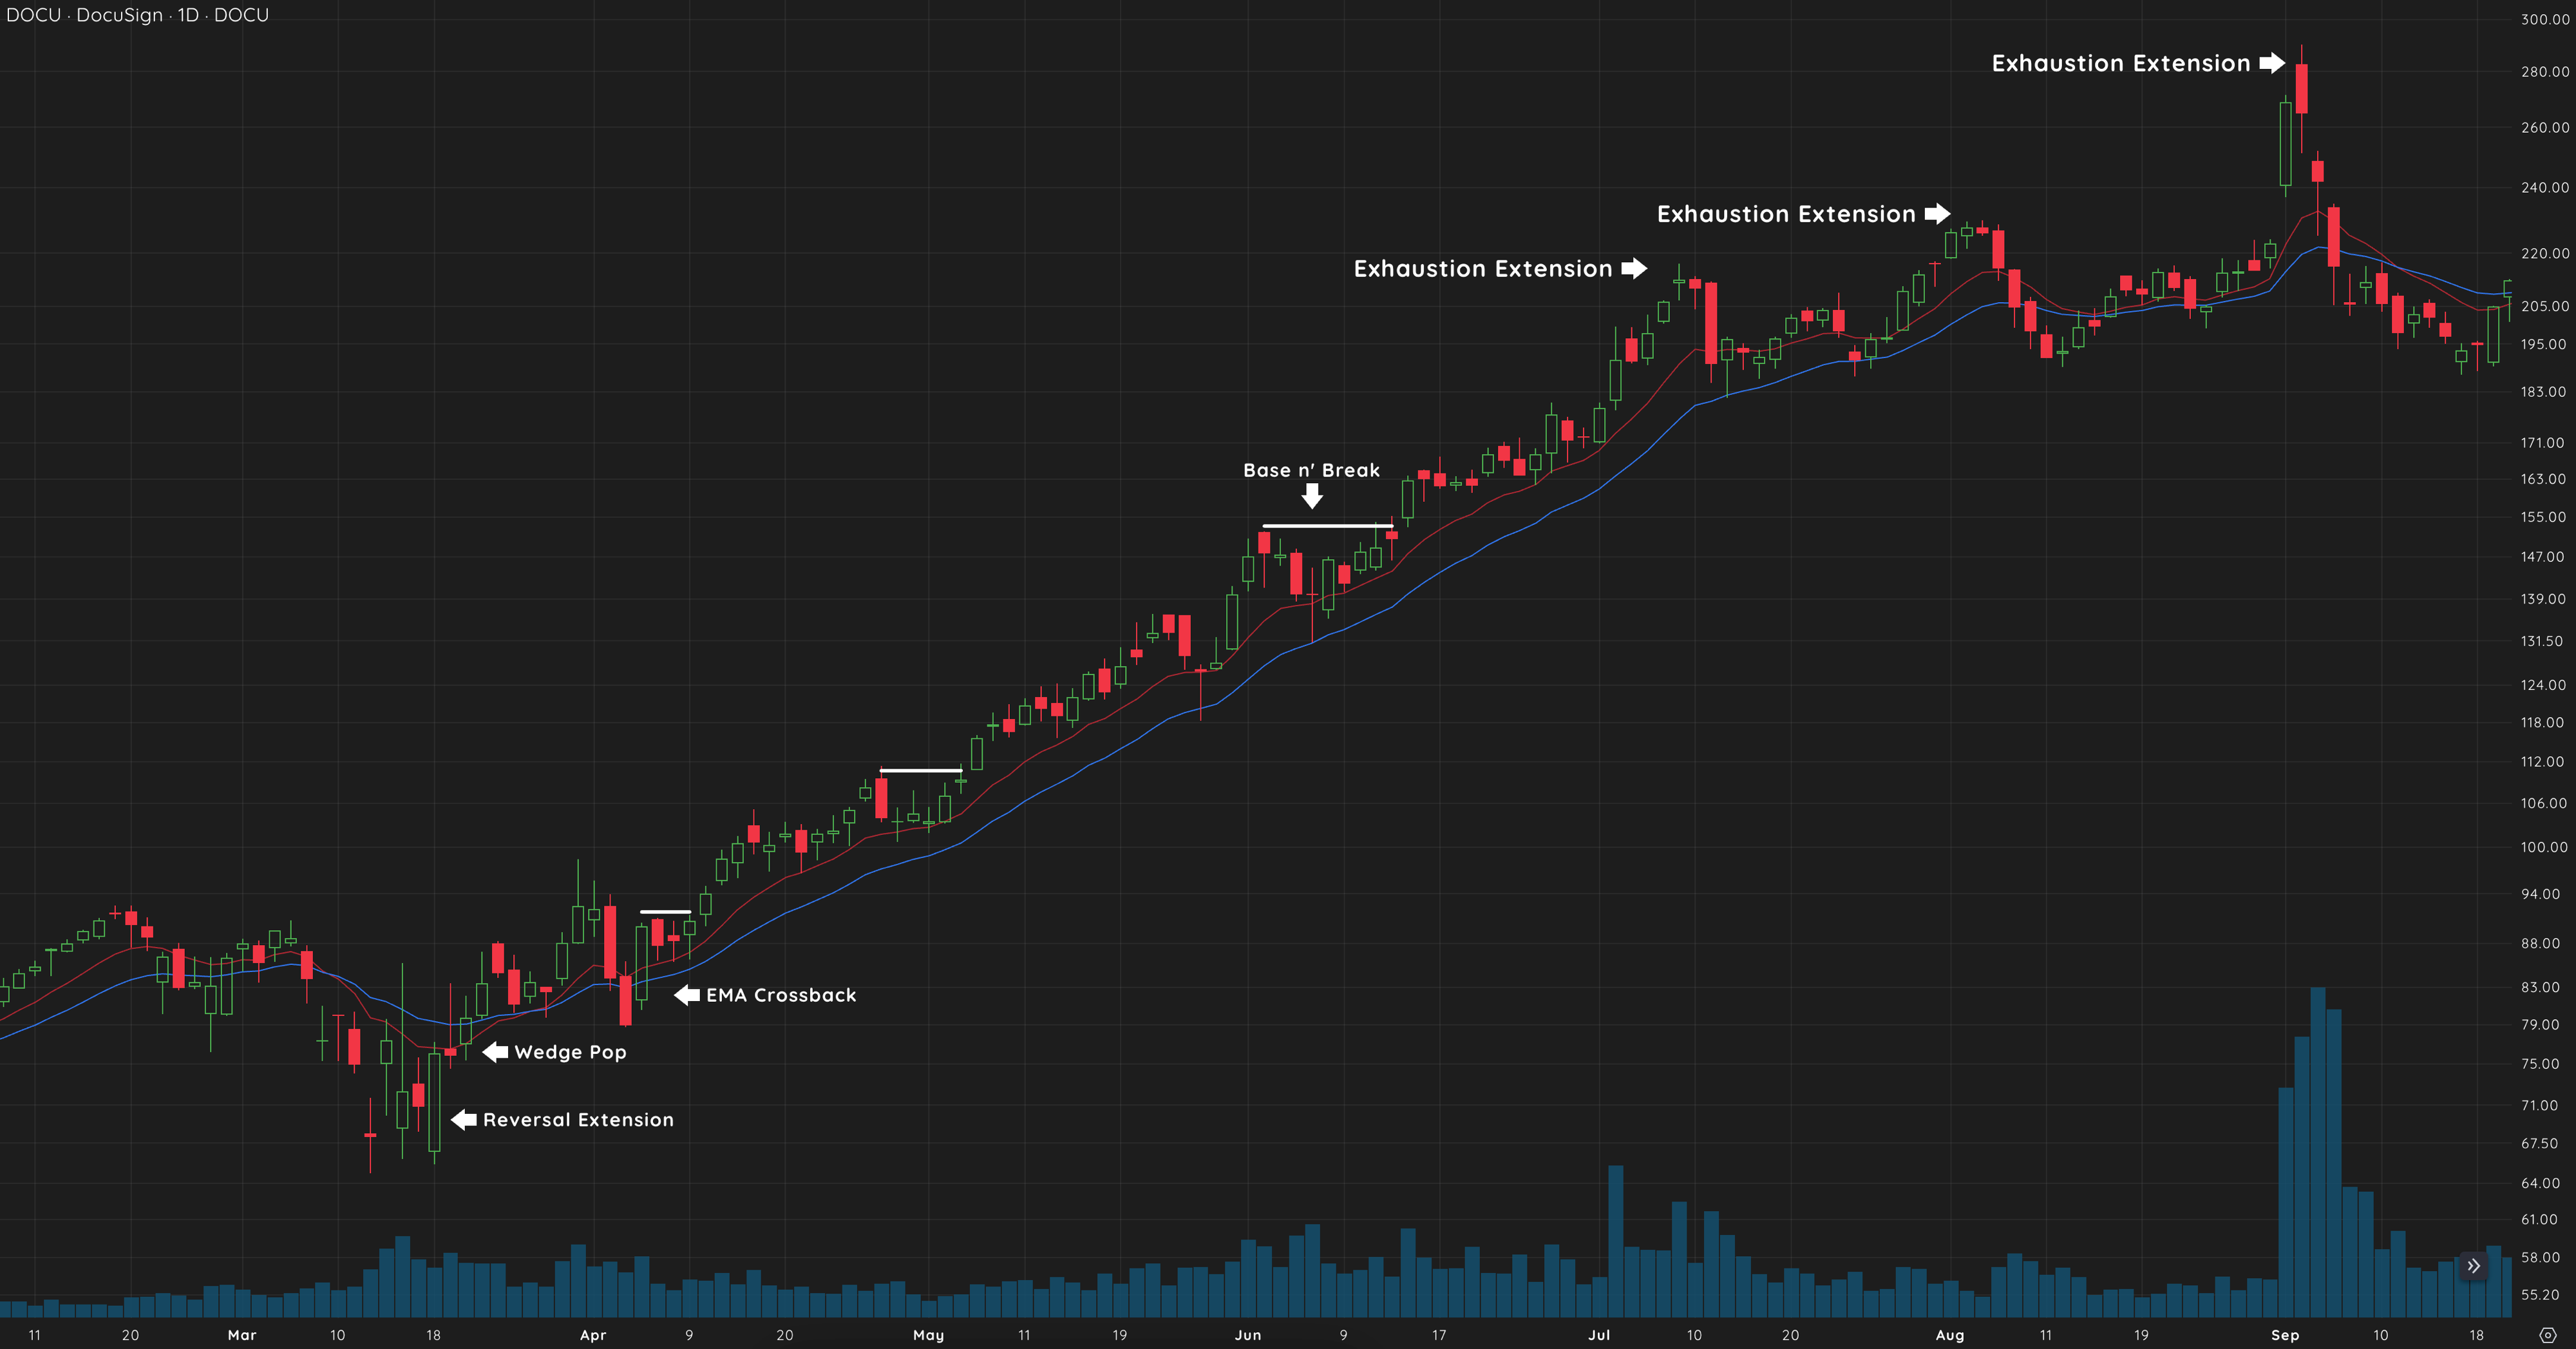
Example: DOCU 2020
In 2020, DOCU showed an Exhaustion Extension after a strong uptrend. Traders who sold part of their position into strength were able to protect their gains before the stock sharply pulled back.

Re-Entering After the Exhaustion Extension
If the stock consolidates after an Exhaustion Extension and forms a new Base n’ Break, it may provide another buying opportunity. However, this should only be done if the stock shows strong support at the moving averages and resumes its uptrend with conviction.
Recognizing Weakness After an Exhaustion Extension
Signs of a Reversal
Once an Exhaustion Extension occurs, be on the lookout for signs that the stock may be forming a top or preparing for a deeper pullback:
Reversal Signals
- Multiple Exhaustion Extensions: If a stock shows multiple Exhaustion Extensions in quick succession, it’s a sign that the uptrend is losing steam. At this point, the stock is likely to consolidate or form a longer-term top
- Price Rejection at Resistance: If the stock struggles to break above a key resistance level after an Exhaustion Extension, it may signal that the buying momentum has dried up
- Wedge Drop: After consolidating, the stock may experience a Wedge Drop, where the price breaks down below the moving averages, signaling the beginning of a new downtrend
Managing Risk
Risk management becomes critical during and after Exhaustion Extensions:
Risk Management Techniques
- Trailing Stops: Use trailing stops to lock in gains as the stock extends higher. This allows you to stay in the trade as long as the uptrend continues but protects your profits if the stock reverses
- Be Defensive: Once you see a second Exhaustion Extension, consider getting more defensive by reducing your position size. The stock is likely to need time to form a new base, and further upside may be limited in the short term
Applying the Exhaustion Extension to Indices and Stocks
Exhaustion Extensions on Indices
Just like individual stocks, market indices can experience Exhaustion Extensions. When this occurs, it’s often a signal to reduce exposure to the broader market.
Index Applications
- Index Exhaustion Extensions: If the market as a whole becomes extended, it’s time to be cautious about adding new positions. Look for signs of weakness in the broader index to guide your overall market exposure
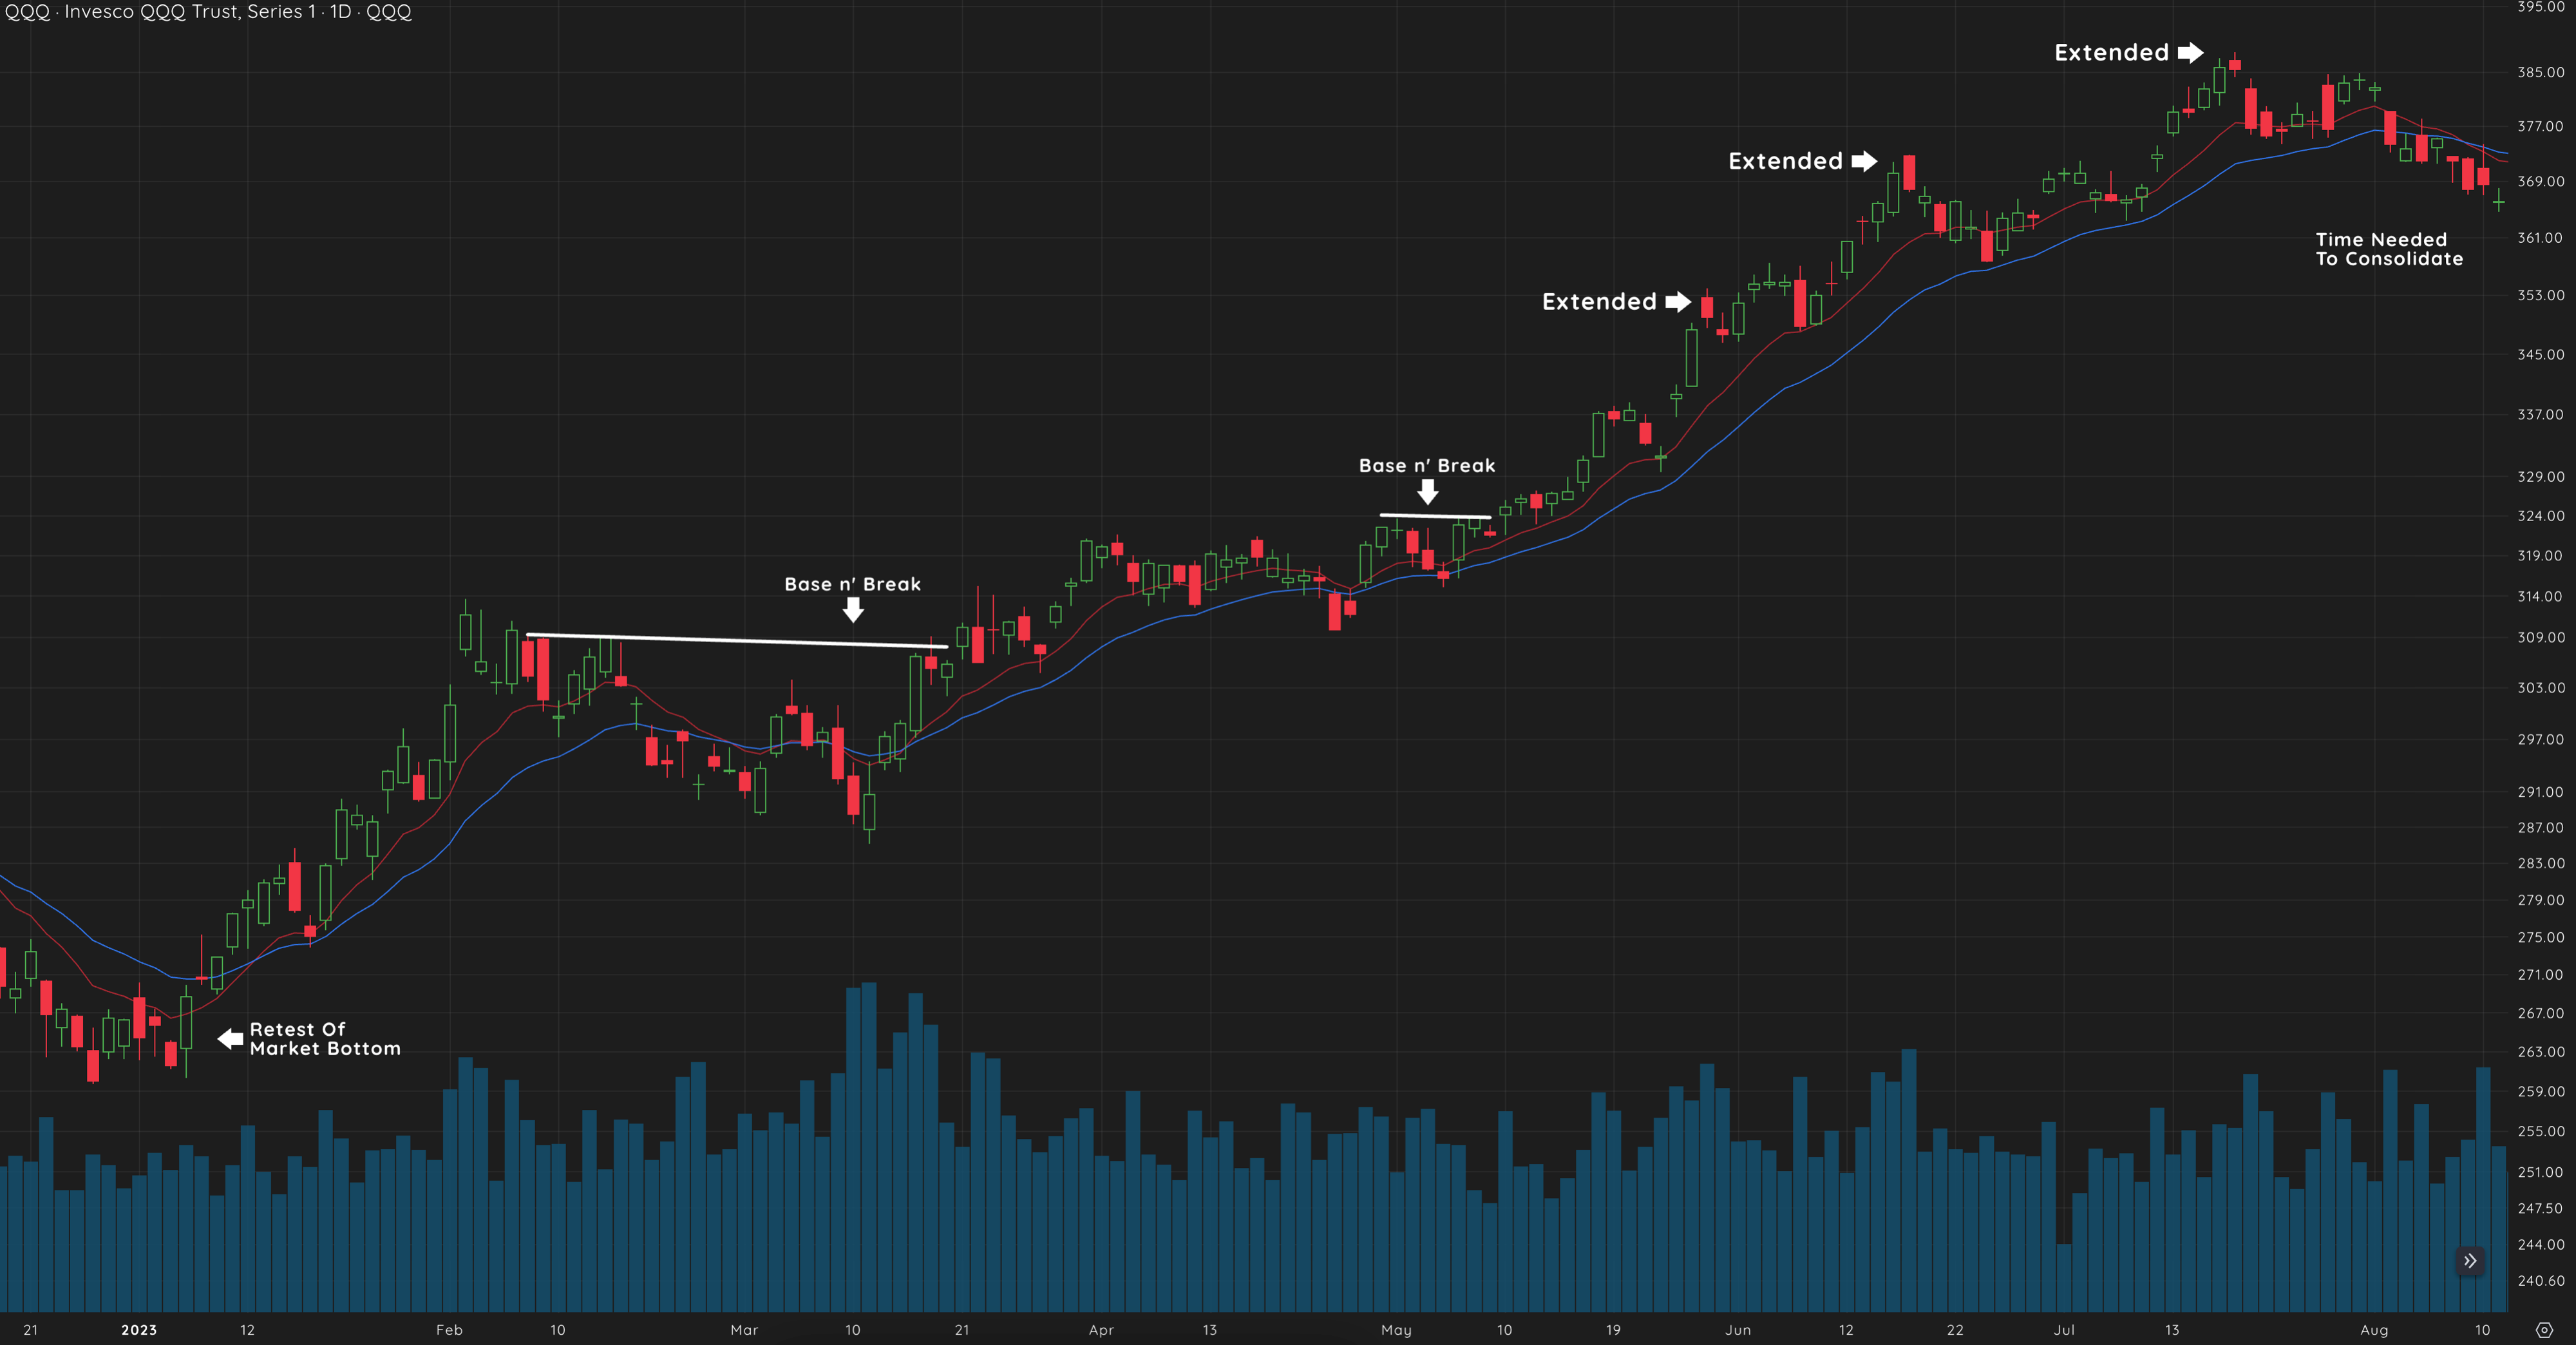
Example: QQQ 2023
In 2023, the QQQ index experienced an Exhaustion Extension as it stretched far above its 10-day EMA. Traders who reduced their exposure were able to avoid the subsequent market pullback.

Relative Weakness in Individual Stocks
If the market is showing signs of an Exhaustion Extension but a stock you own is beginning to break down, this may be a signal to sell. Relative weakness in individual stocks during an extended market is often a precursor to a deeper decline.
Example: SMCI 2024
In 2024, SMCI showed a clear Exhaustion Extension after a prolonged rally. Traders who sold part of their position during the extension were able to lock in gains before the stock entered a period of consolidation.

Reflection
Think about how recognizing an Exhaustion Extension could have helped you in past trades. How will you incorporate this strategy into your future trading decisions?
Conclusion
The Exhaustion Extension is a powerful signal that a stock’s uptrend may be nearing its end. By recognizing this pattern and scaling out of your positions during periods of euphoric price action, you can lock in profits and avoid the sharp reversals that often follow. Remember to stay cautious when you see multiple extensions and always use trailing stops to manage your risk as the stock moves higher.
