The EMA Crossback
Master the critical consolidation phase that offers low-risk entry points in strong uptrends using exponential moving averages
The EMA Crossback is a key moment in the Cycle of Price Action, offering traders an opportunity to enter or add to a position as a stock consolidates after a Wedge Pop. By using the 10- and 20-day exponential moving averages (EMAs), traders can identify this critical pullback, which sets up a low-risk entry point early in the trend. In this lesson, you’ll learn how to spot the EMA Crossback, use it to manage risk, and trade it effectively for maximum gains.
Learning Objectives
By the end of this lesson, you will be able to:
- Identify the EMA Crossback as a key consolidation in the price cycle
- Understand how moving averages support price action during this phase
- Trade the EMA Crossback using pivots, moving averages, and volume signals
- Apply risk management strategies with stops and trailing stop orders
- Use multiple time frames to confirm the strength of the setup
What is the EMA Crossback?

Defining the EMA Crossback
The EMA Crossback is the first time a stock retests the moving averages after a strong upward move, typically following a Wedge Pop. During this phase, the stock consolidates, often moving sideways or drifting slightly downward, allowing the 10- and 20-day EMAs to catch up to the price. This consolidation offers traders a chance to enter or add to a position at a low-risk pivot point.
Key Elements of the EMA Crossback
Essential Components
- Price Consolidation: After the Wedge Pop, the price pulls back toward the moving averages. This consolidation is often marked by lower volatility and lighter volume, as the stock digests its recent gains.
- Moving Average Support: As the stock drifts sideways or slightly downward, the rising EMAs act as a support zone for the price.
- Pivot Point Formation: A pivot point forms during this phase, offering a clear level to manage risk. If the stock breaks through the pivot with strength, the uptrend is likely to continue.
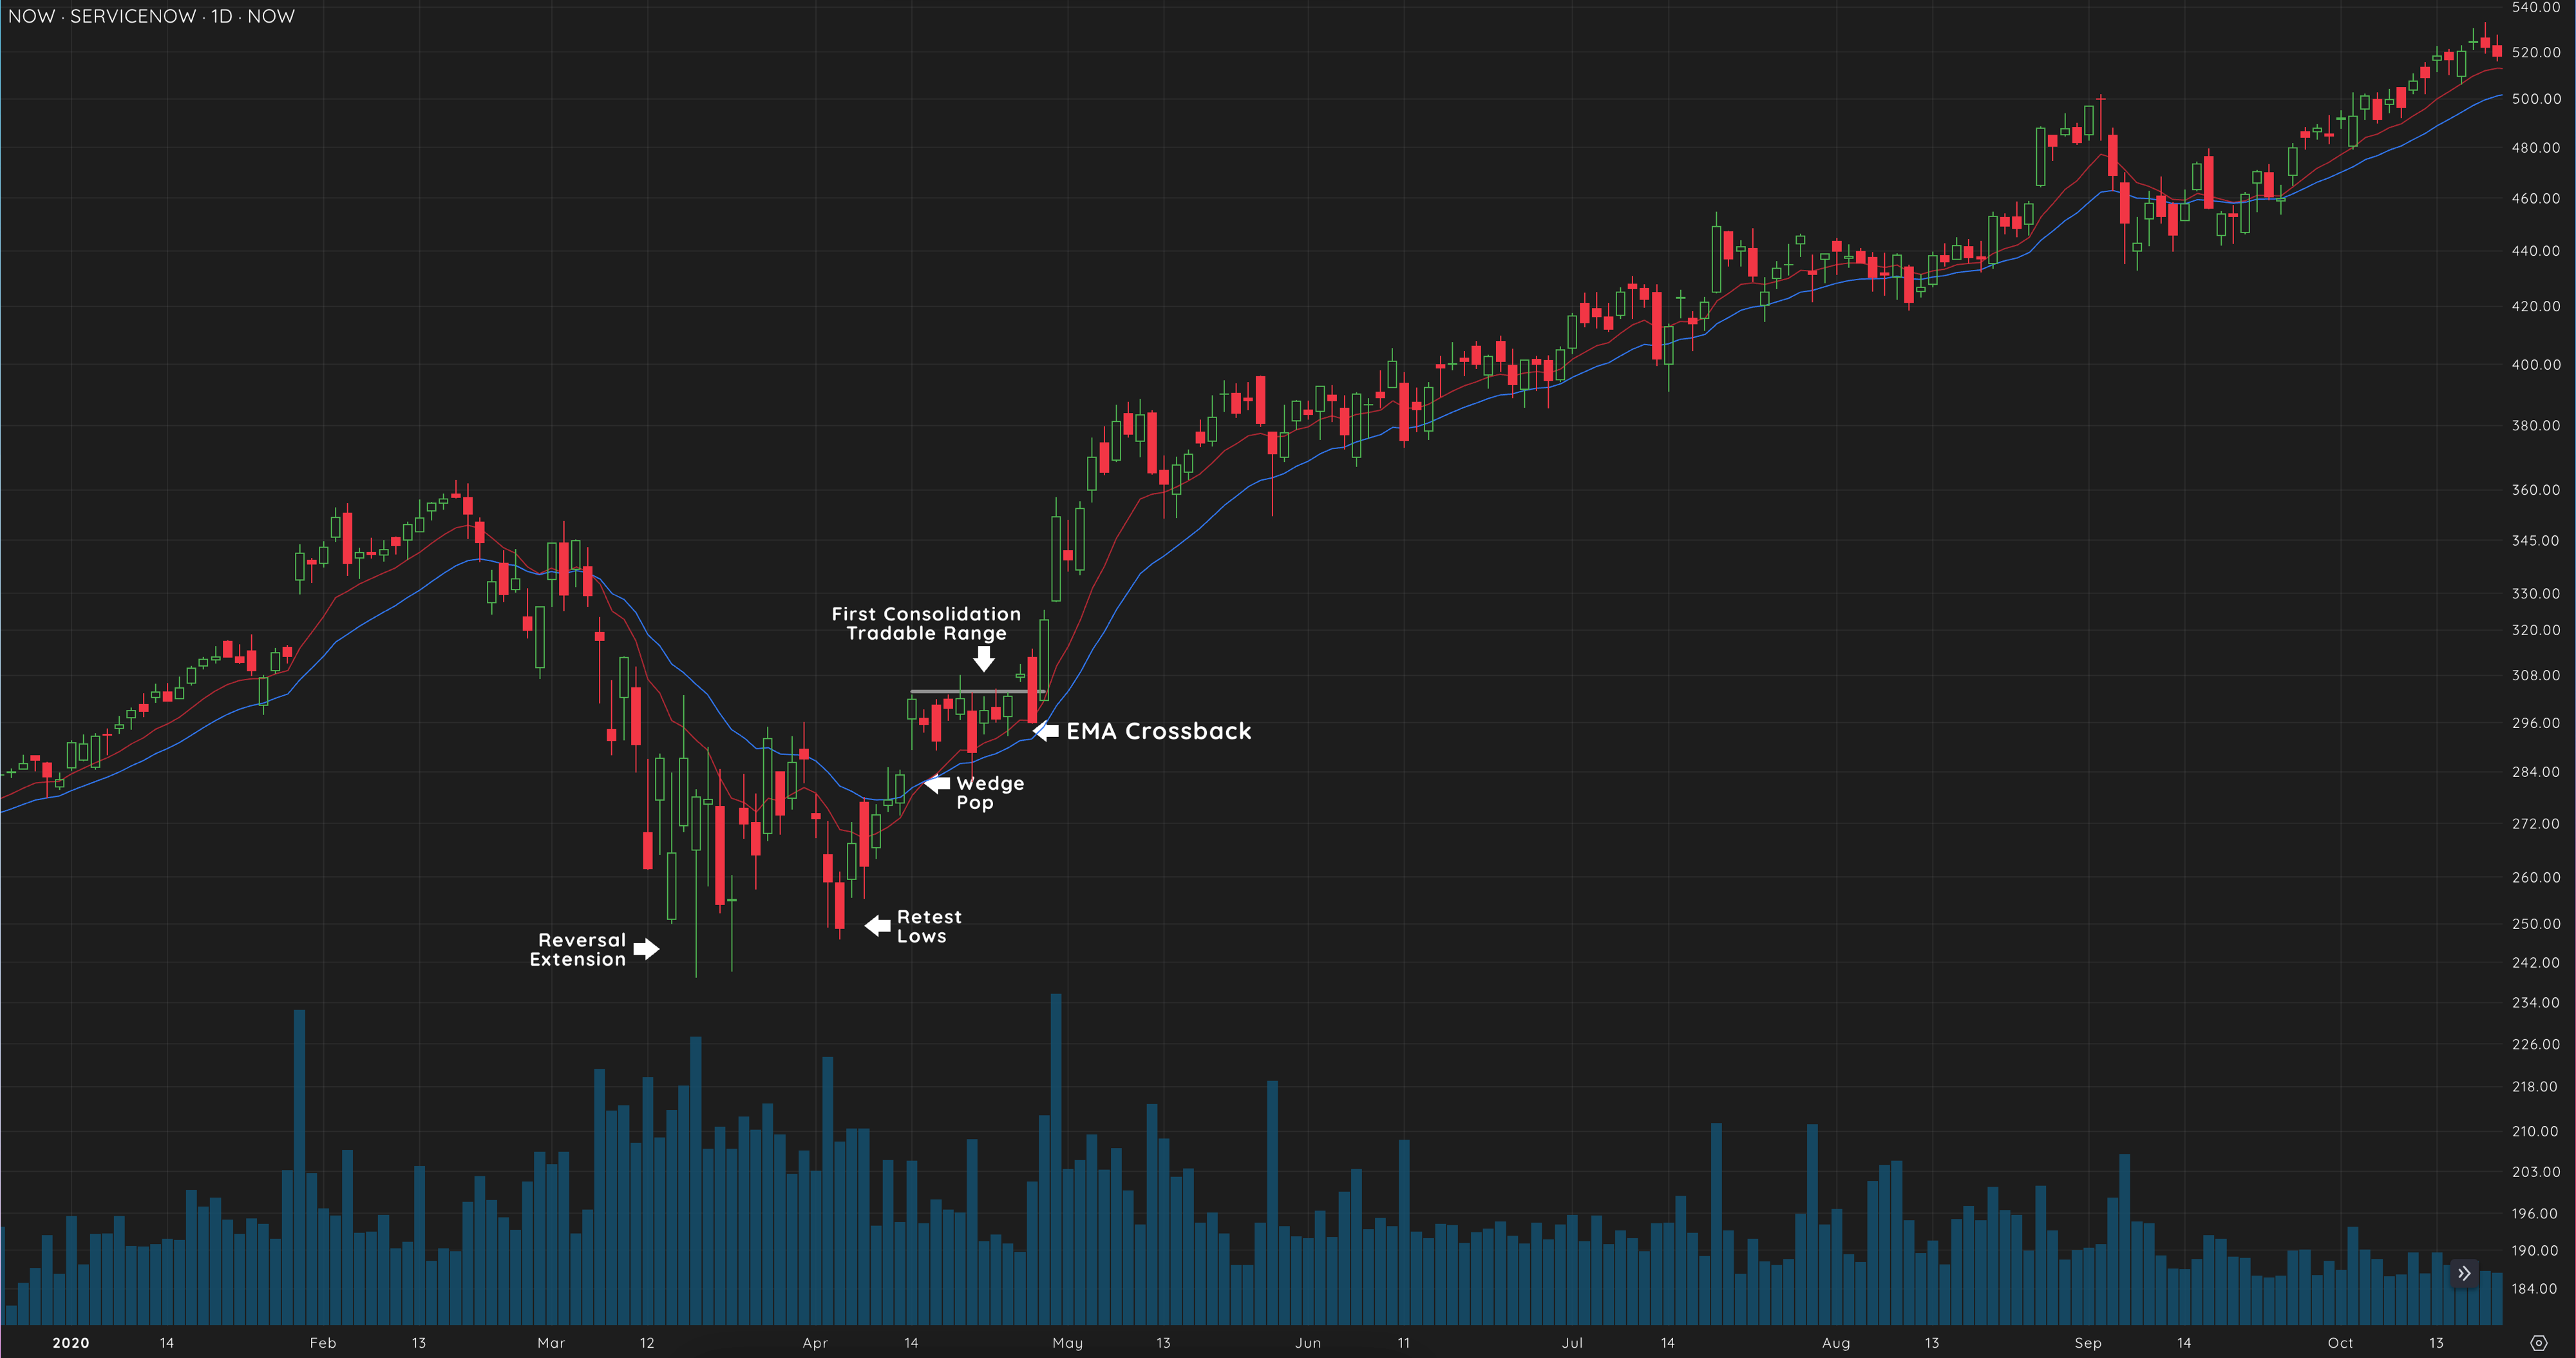
Example: NOW 2023
In 2023, NOW demonstrated a textbook EMA Crossback, where the price pulled back into the moving averages after a strong Wedge Pop and then rallied to new highs.

NOW 2023
Recognizing the EMA Crossback in Action
Price Action and Volume Signals
To identify a strong EMA Crossback, focus on how the stock behaves when it encounters the moving averages:
Key Signals
- Price Respecting Moving Averages: Look for price bars that show support near the 10- and 20-day EMAs. These price levels indicate that buyers are stepping in as the stock consolidates.
- Decreasing Volume on Pullback: Ideally, volume should decrease as the stock pulls back into the moving averages. This signals that selling pressure is fading, and the stock is ready to resume its uptrend.
Trading Through the Pivot
Once the stock finds support near the moving averages, the next key step is to watch for a break through the pivot point:
Pivot Confirmation
- If the price breaks above the pivot with strong volume, it confirms that the uptrend will likely continue
- If the price fails at the pivot and reverses lower, it indicates the timing is not right, and you should wait for another setup
Trading the EMA Crossback
Entry and Stop Placement
The EMA Crossback offers a low-risk buy point early in the Cycle of Price Action. Here’s how to trade it:
Trading Steps
- Entry: Go long once the stock shows strength at the pivot, typically marked by a strong price bar with increased volume
- Stop Placement: Place your stop just below the pivot or the nearest low formed during the consolidation. This keeps your risk contained if the trade moves against you
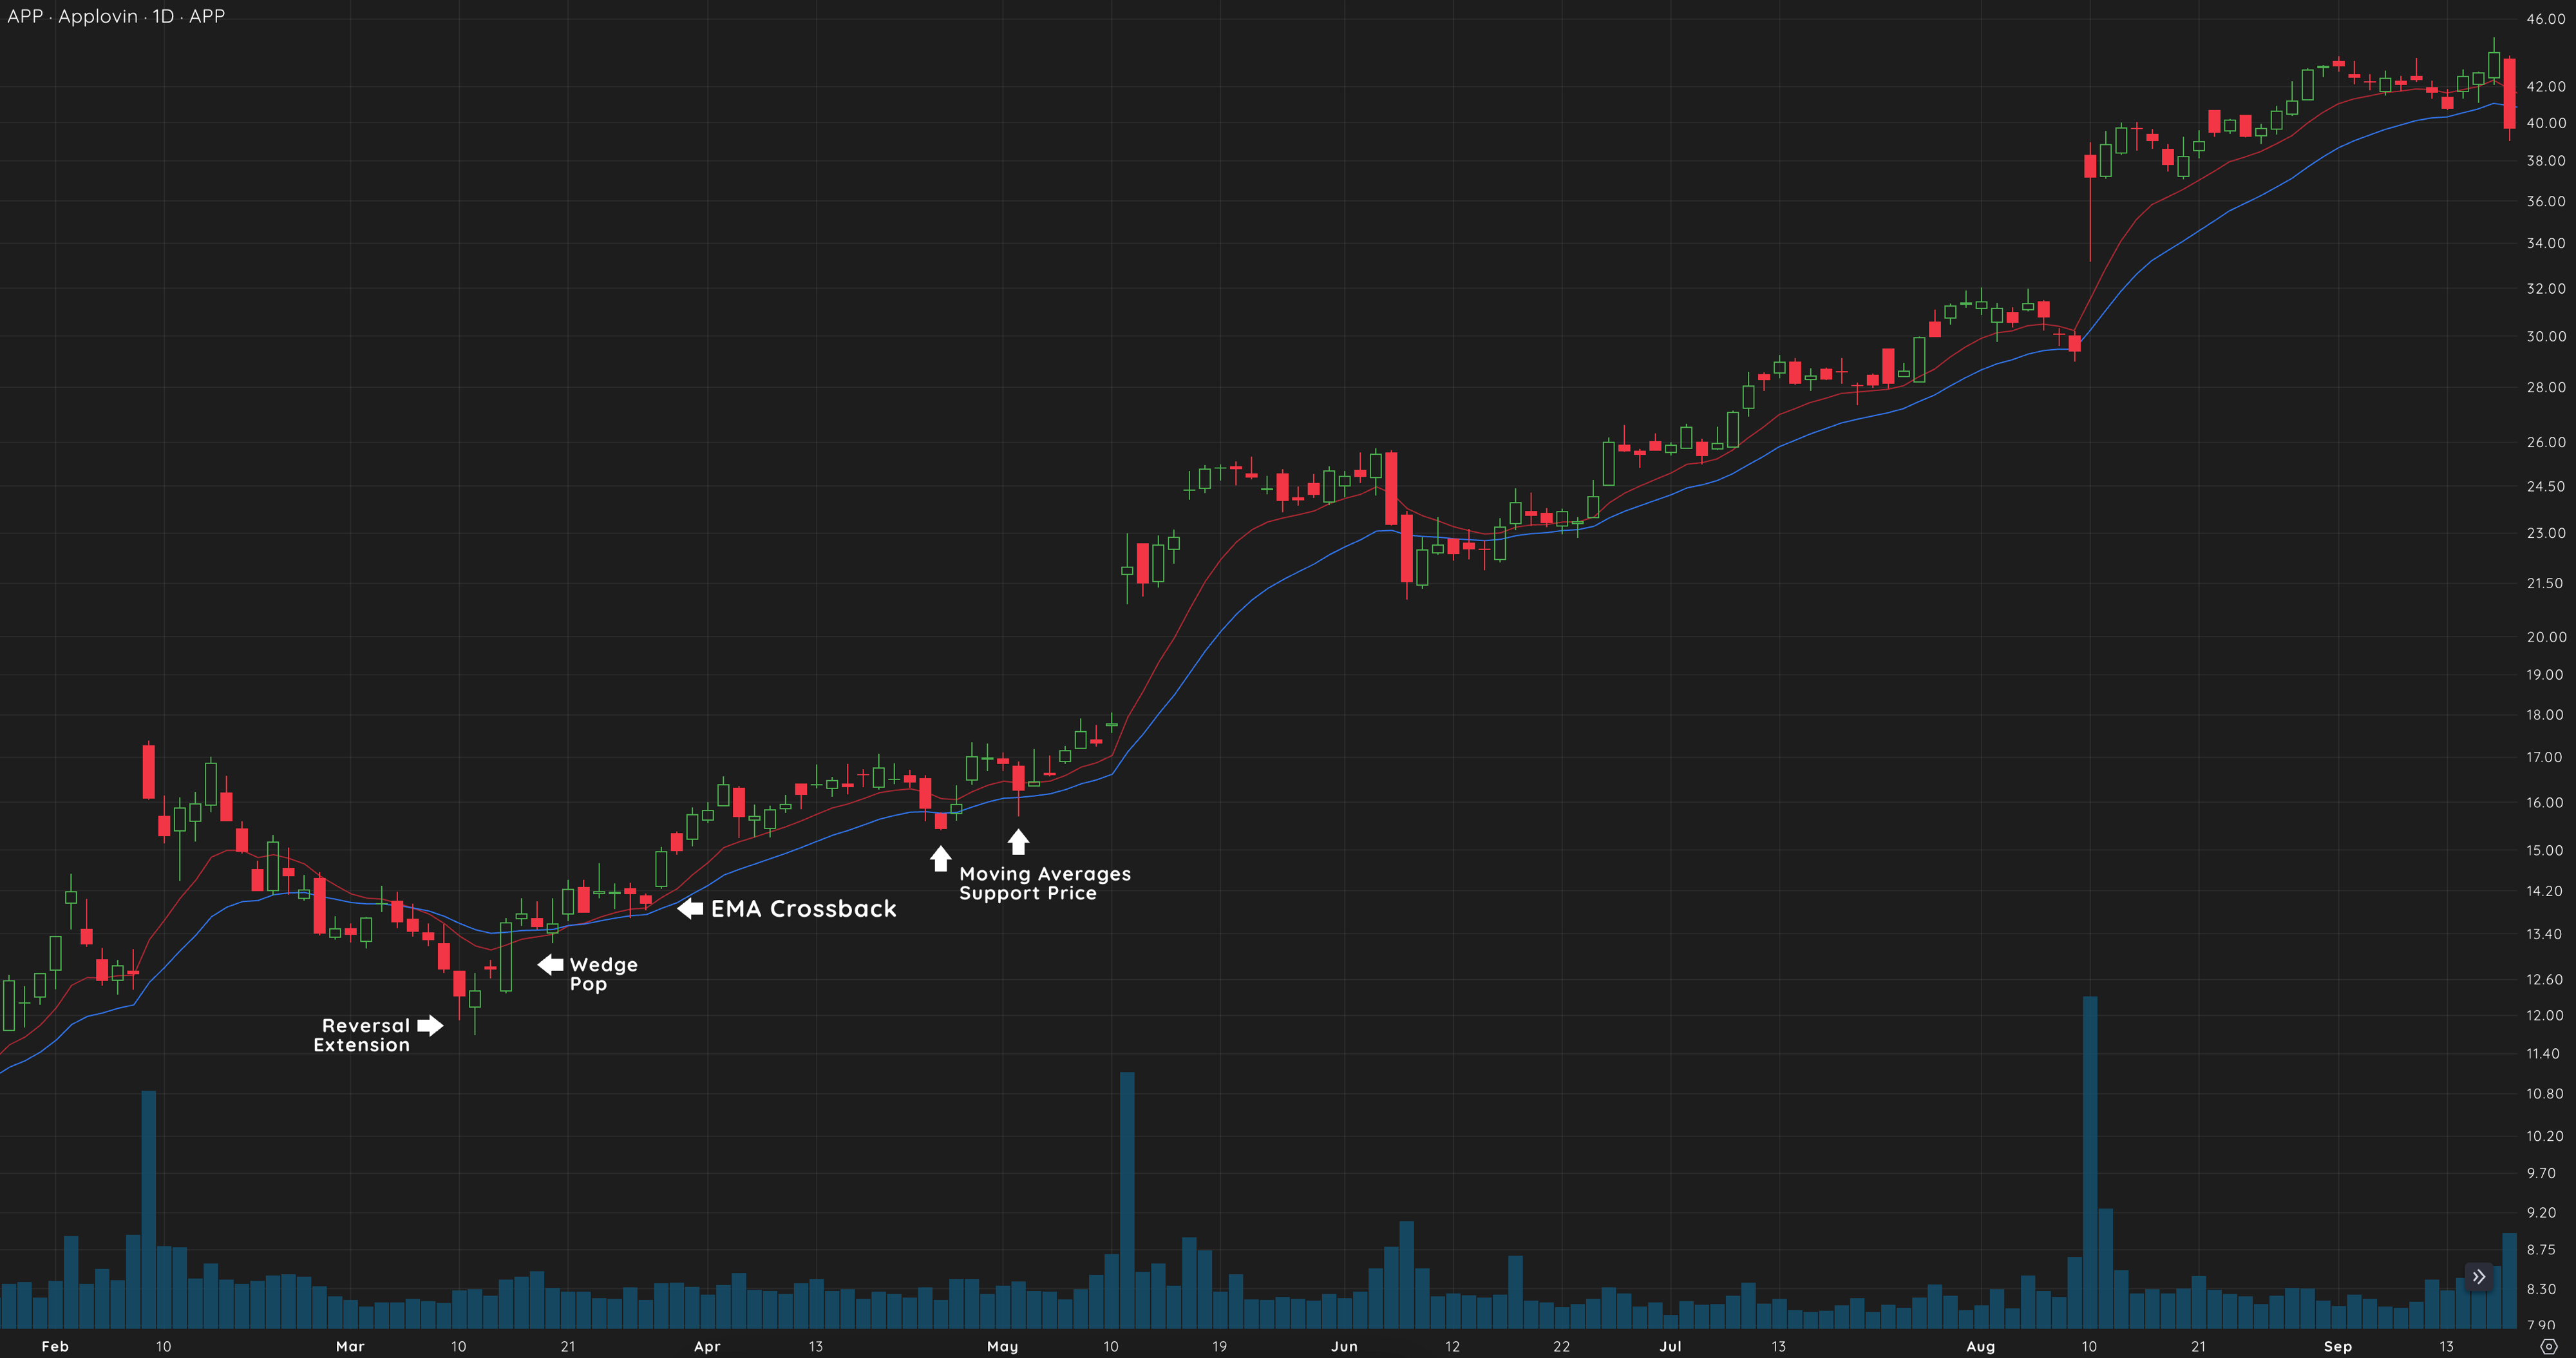
Example: APP 2023
In 2023, APP showed positive price action near the 10-day EMA, offering traders a low-risk entry during the EMA Crossback. Stops were placed just below the recent lows to minimize downside risk.

APP 2023
Managing the Trade
Once the stock moves higher, use a trailing stop to lock in gains. As the price rises, adjust your stop to follow the moving averages. This strategy allows you to hold the position longer while minimizing the risk of giving back profits.
Example: DDOG 2021
In 2021, DDOG pulled back into its 20-day EMA after a strong Wedge Pop, forming an ideal EMA Crossback. By entering at the pivot and trailing stops as the price advanced, traders were able to hold the position through the trend’s continuation.

DDOG 2021
The Role of Multiple Time Frames
Using Time Frames for Confirmation
Oliver Kell recommends using multiple time frames to confirm the strength of the EMA Crossback:
Time Frame Analysis
- Daily and 65-Minute Charts: These can help identify intermediate-term support levels and confirm positive price action near the moving averages
- 15-Minute Charts: These are useful for pinpointing precise entry points when the stock begins to break through the pivot
By aligning lower and higher time frames, you can ensure that the stock is showing consistent strength across the board.
Indices and Stocks: Applying the EMA Crossback to Leaders
Leading Stocks in a New Cycle
The EMA Crossback is not only a powerful tool for individual stocks but also for identifying strength in the broader market. As the stock index forms an EMA Crossback, the leading stocks will often be further along in their Cycle of Price, showing stronger price action and breaking out of bases.
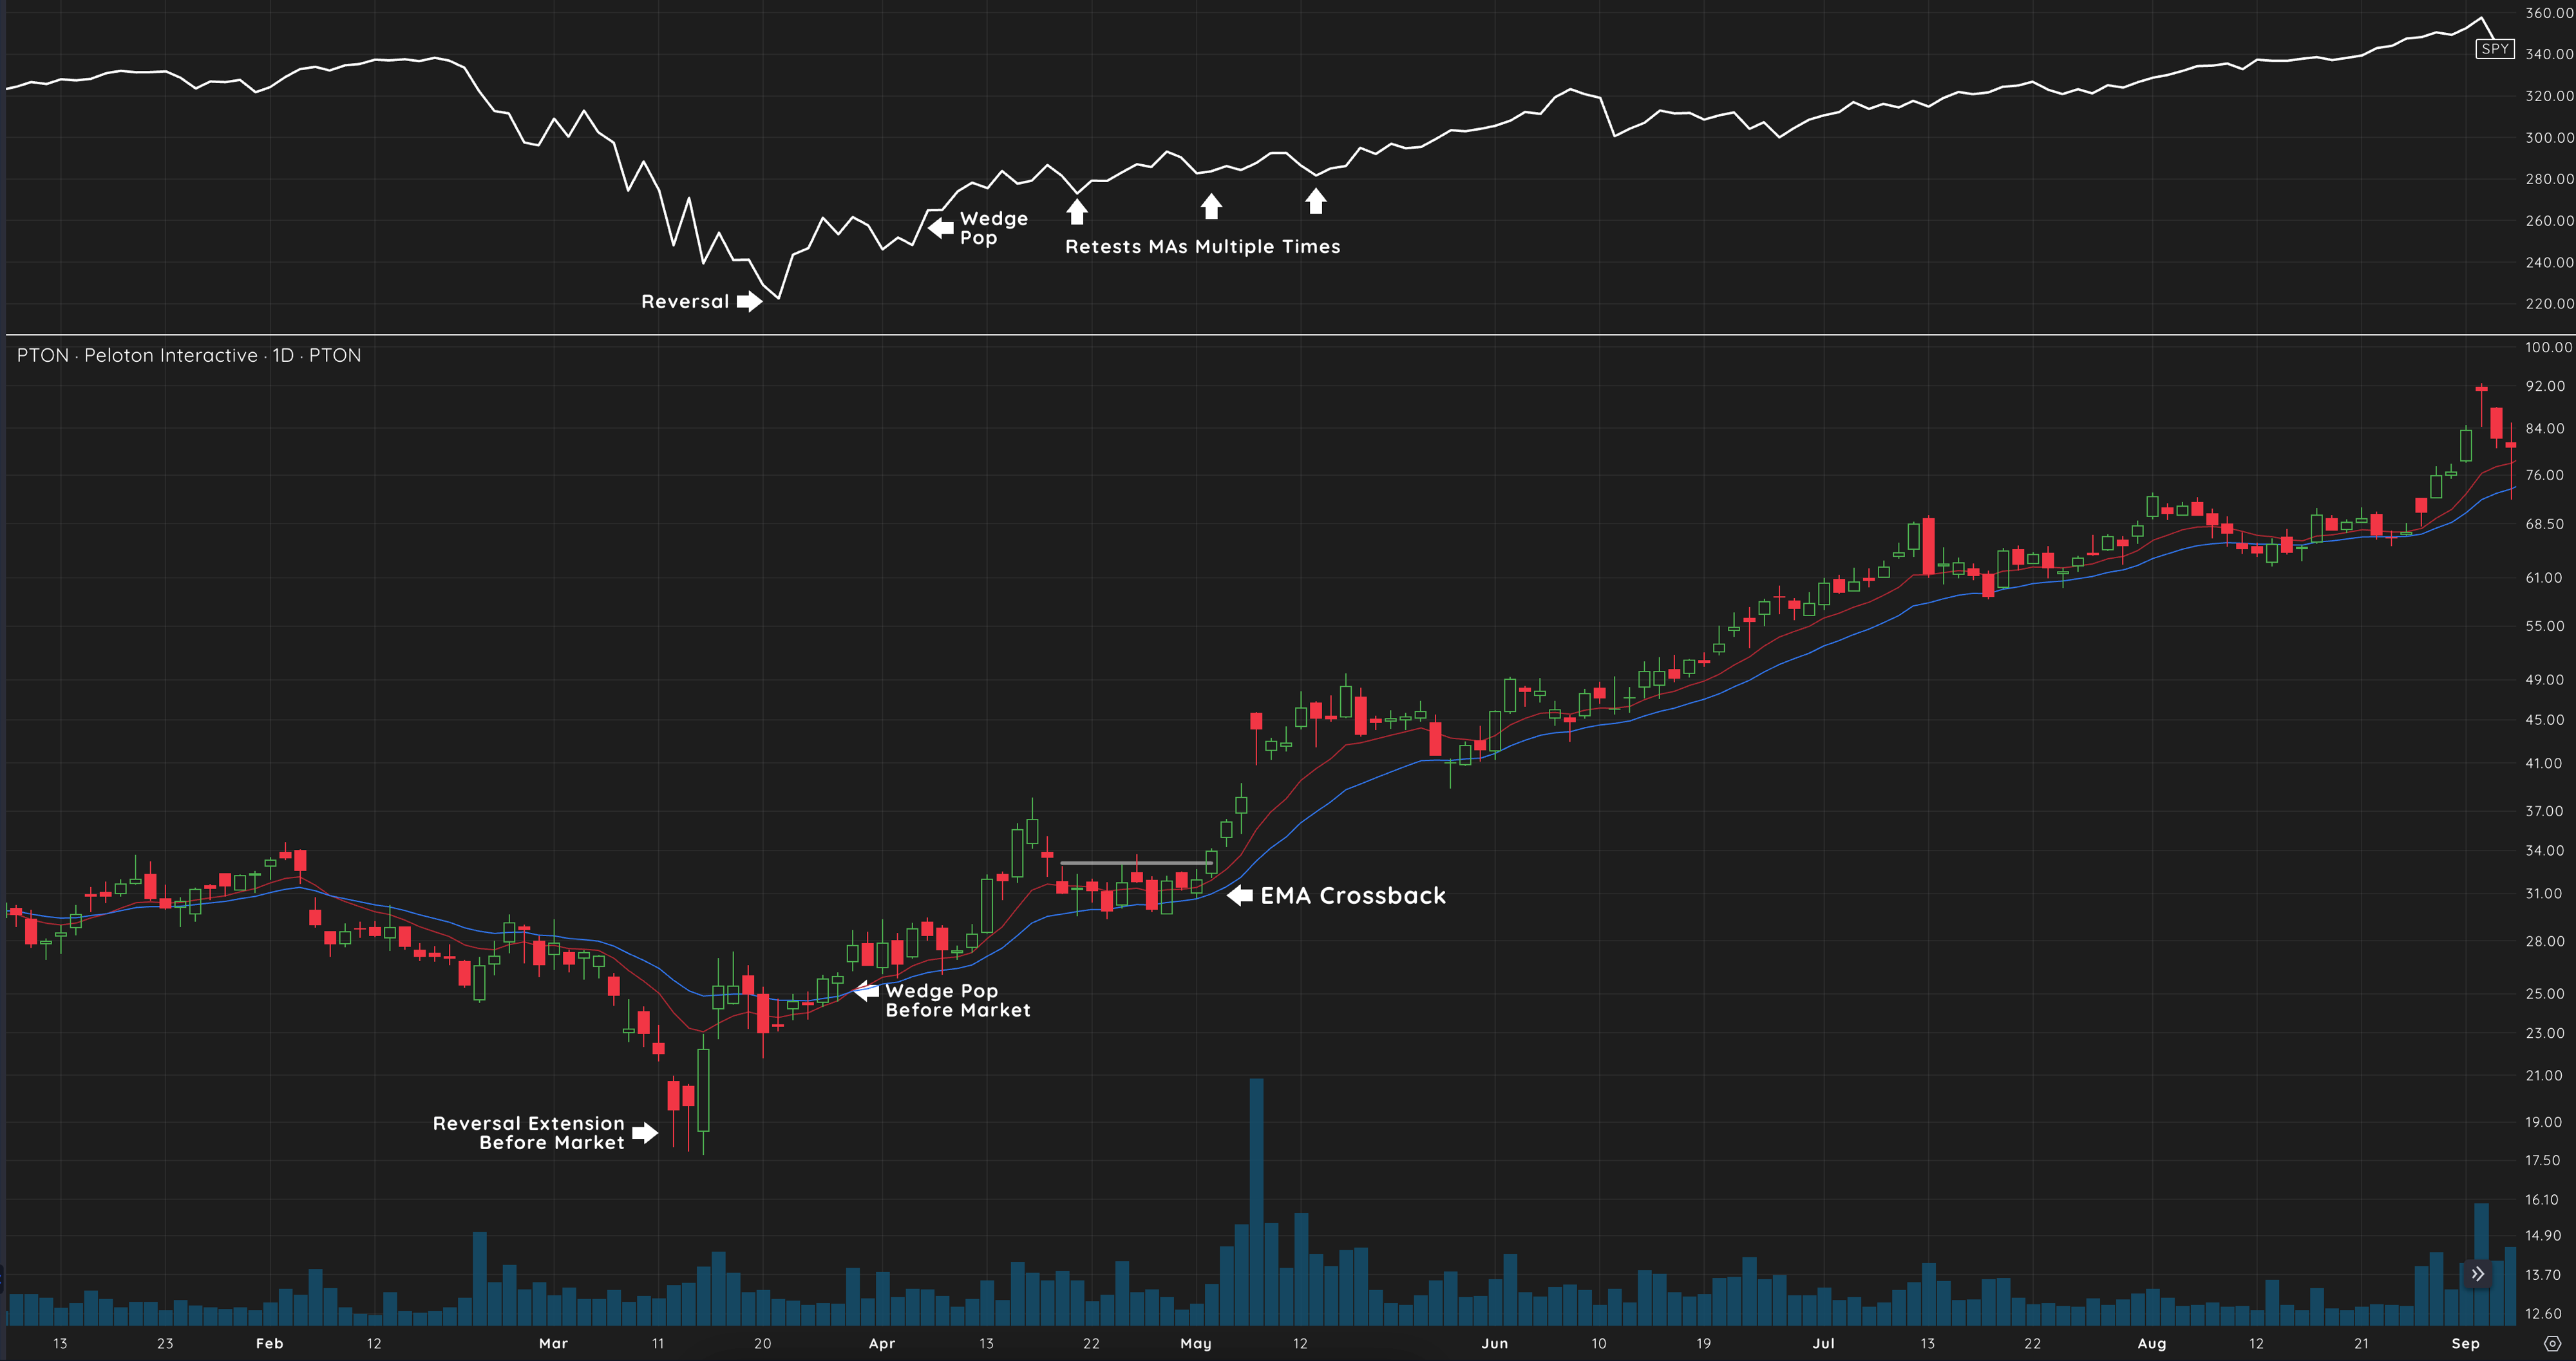
Example: PTON 2020
This stock reversed off its lows and formed a Wedge Pop before the broader market (SPY). When PTON hit its EMA Crossback, it continued its upward trend, gaining 500% while the market slowly recovered.

PTON 2020
Identifying Opportunities in the Market
When the market forms an EMA Crossback, it’s time to screen for stocks with relative strength—those that are consolidating against their moving averages and poised to make new highs. Focus on stocks that are already leading the market cycle, as they tend to outperform once the general market shows strength.
Reflection
How can you apply the EMA Crossback to your trading strategy? Consider reviewing your recent trades—did you wait for a consolidation into the moving averages before entering, or did you chase the price too early?
Conclusion
The EMA Crossback is a crucial phase in the Cycle of Price Action, providing a low-risk entry point that can lead to significant gains. By understanding how moving averages support price action, recognizing pivot points, and confirming setups with multiple time frames, you’ll be able to take advantage of this powerful trading strategy. Remember to focus on the strongest stocks during market uptrends and use stops to manage risk effectively.
