Descending Channels
Master powerful multi-week continuation patterns that offer low-risk entry points into stocks poised for strong moves
Descending channels are powerful multi-week continuation patterns that offer traders low-risk entry points into stocks poised for a strong move. On a daily chart, they appear as lower highs and lower lows, but on the weekly chart, they often resemble bull flags. This lesson will focus on identifying, trading, and managing descending channel setups for optimal returns.
Learning Objectives
By the end of this lesson, you will be able to:
- Recognize descending channels on daily and weekly charts
- Identify key characteristics, including tightness, relative strength, and volume clues
- Develop entry and stop-loss strategies for descending channels
- Understand how to manage trades and scale positions during the breakout
What Is a Descending Channel?
Definition
A descending channel is a pattern of lower highs and lower lows that represents a multi-week pullback in price. It often occurs during a broader uptrend and signals a temporary pause or consolidation before the next move higher.
Key Characteristics
- Lower Highs and Lower Lows: Clear downward-sloping trendlines form the structure of the channel
- Tight and Uniform Action: Price movements should be controlled and not erratic or wide-ranging
- Volume Behavior: Volume typically declines during the pullback, indicating reduced selling pressure
- Near Key Levels: Often forms near important support levels, such as the 50-day or 200-day SMA

Recognizing the End of the Channel
Change of Character
The end of a descending channel is marked by a shift in price behavior, such as:
- A higher low forming within the channel
- Price holding above a previous bar’s low, signaling that buyers are stepping in
Trigger Points
The breakout is confirmed when the stock:
- Clears the descending channel’s upper trendline
- Breaks back above key moving averages (e.g., the 10-day or 20-day EMA)
Entry Strategies for Descending Channels
Primary Entry Point: The Wedge Pop
- The wedge pop occurs when price breaks out of the descending channel and reclaims moving averages, such as the 10-day or 20-day EMA
- Entry Trigger: Place a buy order just above the descending trendline or pivot point of the channel breakout
Aggressive Entry Option
- Experienced traders may buy on intraday price action, such as an outside reversal bar or a bullish counterattack bar near the lower end of the channel
Stop-Loss Placement
- Place your initial stop just below the low of the channel or the nearest support level
- Adjust the stop higher as the trade progresses, reducing risk
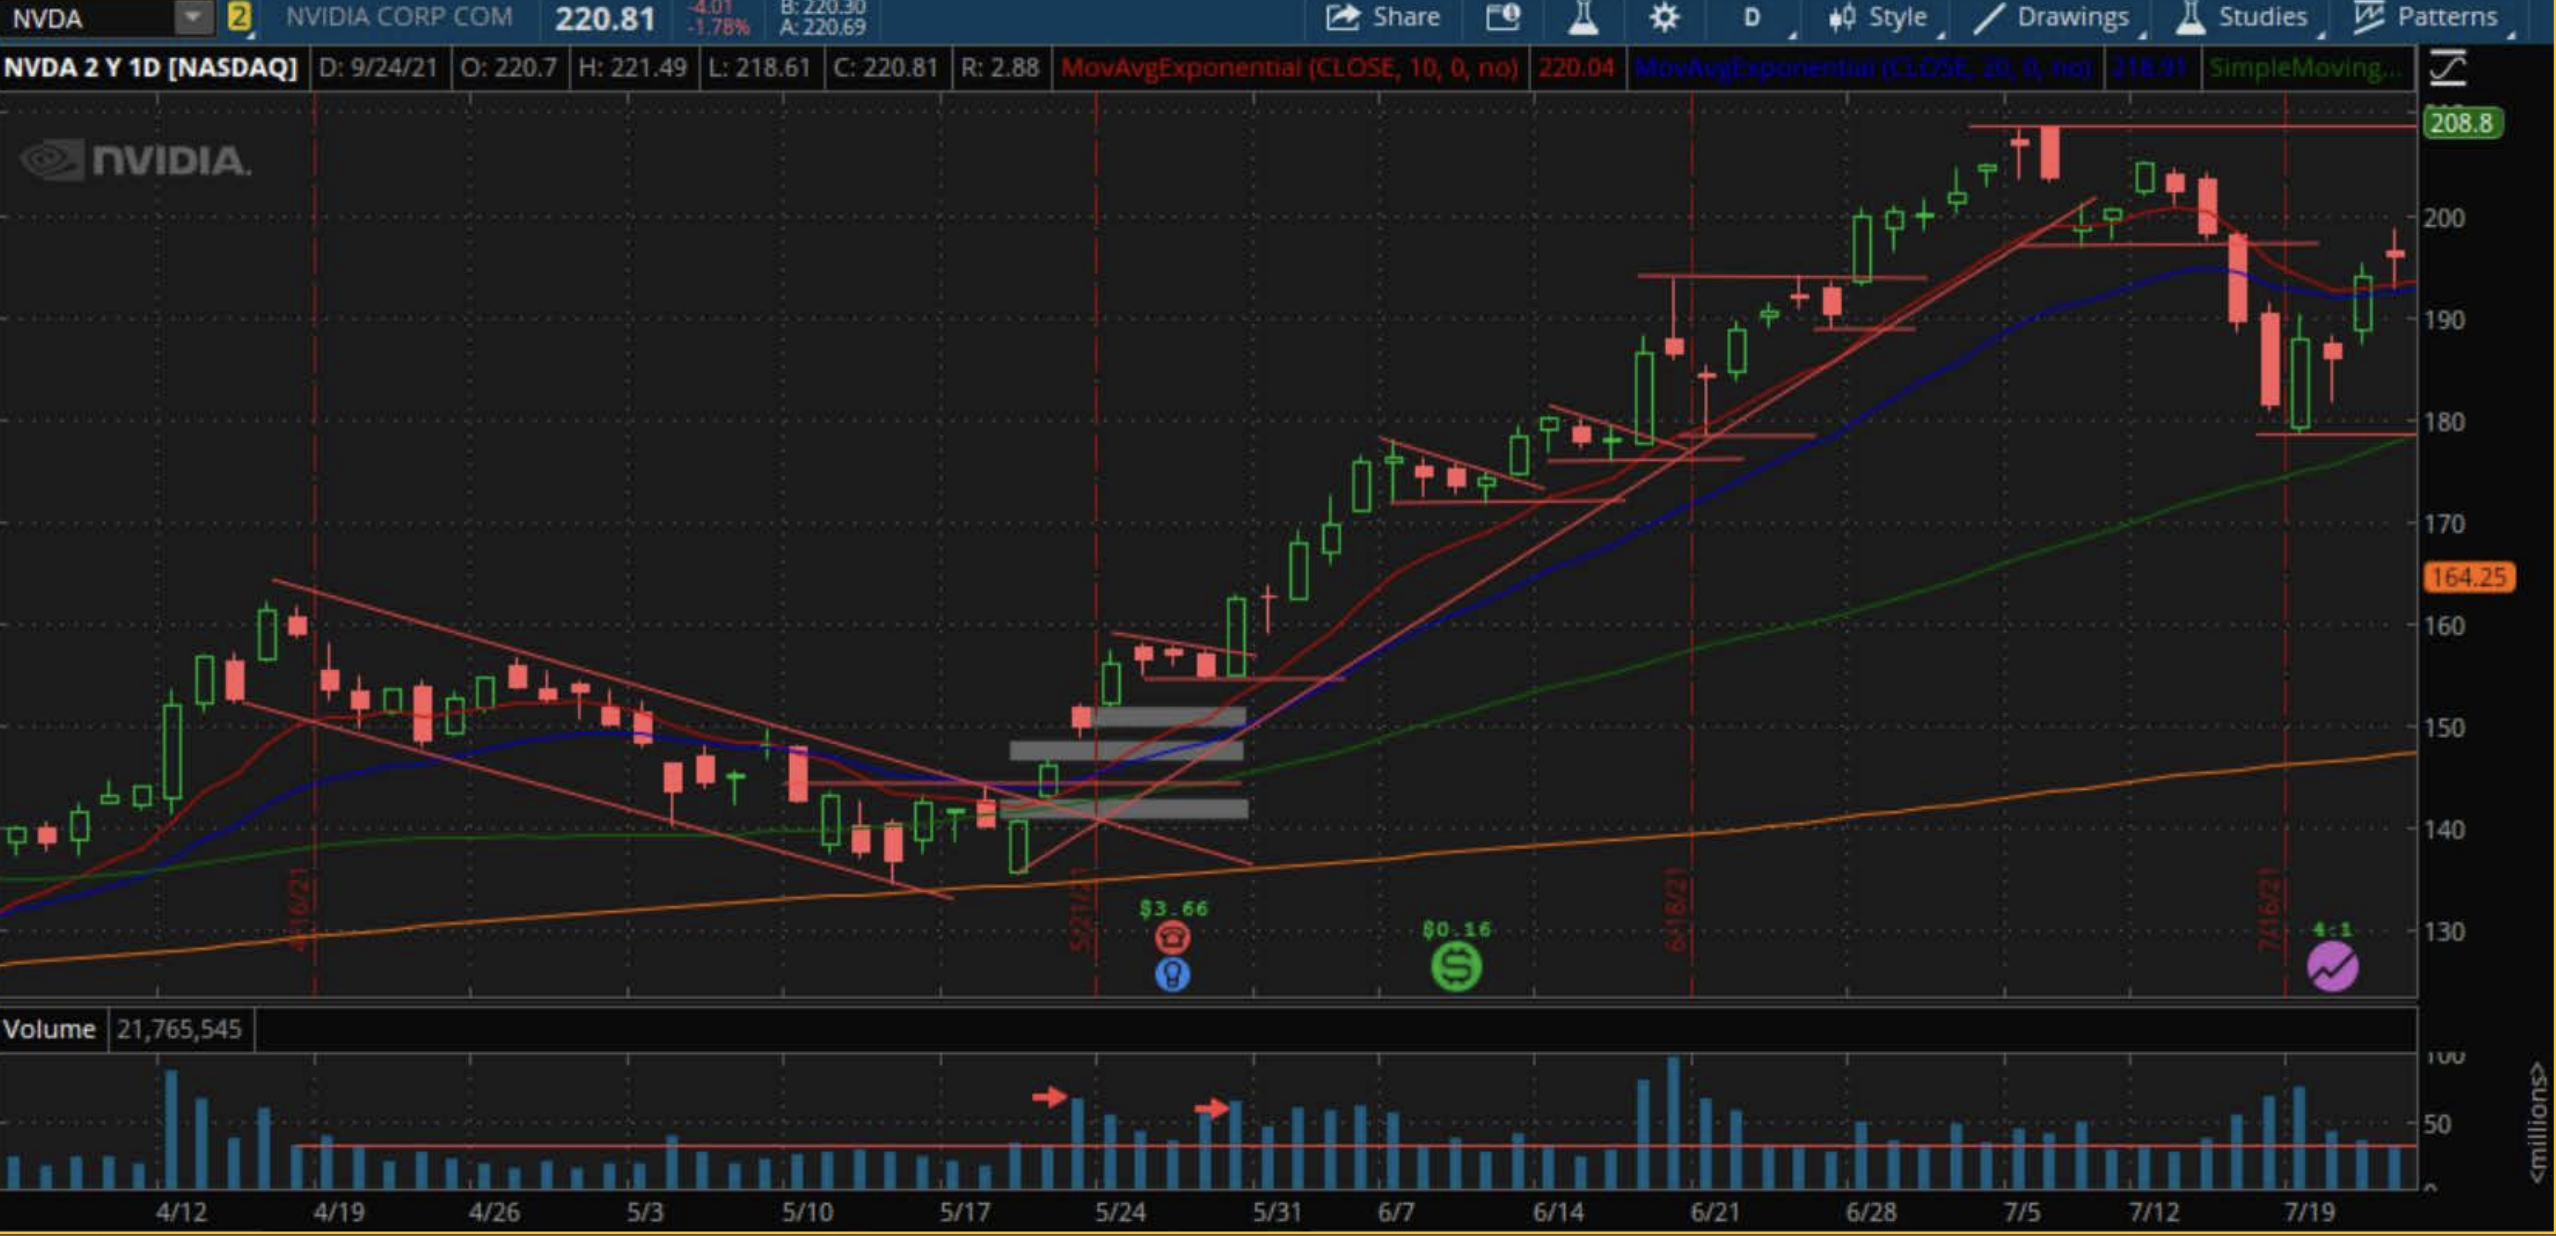
Example: Nvidia Descending Channel
Nvidia formed a tight descending channel near its 50-day and 200-day SMA. After a bullish counterattack bar confirmed buyer support, the wedge pop occurred as price broke through the descending trendline and moving averages.

Managing the Trade
Building Your Position
- Initial Buy: Start with a small position as price breaks out of the channel
- Add During Consolidation: Add to your position during any subsequent consolidations, such as a bull flag, to build size
- Final Addition: Consider topping off your position once a new high is cleared
Scaling Stops
- After the breakout, move your stop-loss to just below the pivot point
- For subsequent patterns (e.g., bull flags), use the low of the pattern as the new stop level
Evaluating Pattern Quality
Tightness Matters
- The best descending channels have tight and uniform price action. Loose or erratic channels are less reliable
- Tight channels suggest strong buyer interest, even during a pullback
Relative Strength
- Compare the stock’s performance to the broader market or sector
- Stocks that hold up well during market corrections (e.g., tight descending channels compared to larger market sell-offs) demonstrate relative strength
Volume Clues
- Declining volume during the channel suggests reduced selling pressure
- Look for unfilled gaps or volume spikes near the breakout, signaling institutional interest
Reflection
Why is tightness in a descending channel important for predicting a strong breakout?
Action Items
- Analyze three stocks that are forming descending channels. Monitor their behavior near key moving averages and look for signs of a wedge pop
- Track these setups for potential breakouts and practice scaling into the position using smaller initial buys
- Document your findings and refine your approach based on the outcomes of these trades
Conclusion
Descending channels are powerful continuation patterns that offer clear, low-risk entry points during broader uptrends. By focusing on tightness, relative strength, and volume, you can identify high-probability setups and manage your risk effectively.
Combine descending channels with broader market context and key moving averages to refine your trades. Tight patterns and strong relative strength are often precursors to significant price moves.
