The Cup and Handle Pattern
Master the classic continuation pattern with modern techniques including early entries, market context evaluation, and advanced position management strategies
The cup and handle is a classic continuation pattern that combines a rounded consolidation (the cup) with a smaller, tighter consolidation (the handle) before breaking out to new highs. Though widely recognized, the nuances of this pattern, such as the depth of the cup and the importance of market context, are often overlooked. This session will explore how to identify, enter, and manage cup and handle trades with a focus on modern techniques like the price cycle and early entries.
Learning Objectives
By the end of this lesson, you will be able to:
- Recognize the cup and handle pattern and its components
- Evaluate the depth of the cup relative to market conditions
- Use advanced techniques, like the price cycle, for early entries before the handle forms
- Identify optimal buy points and manage trades effectively
What Is a Cup and Handle Pattern?
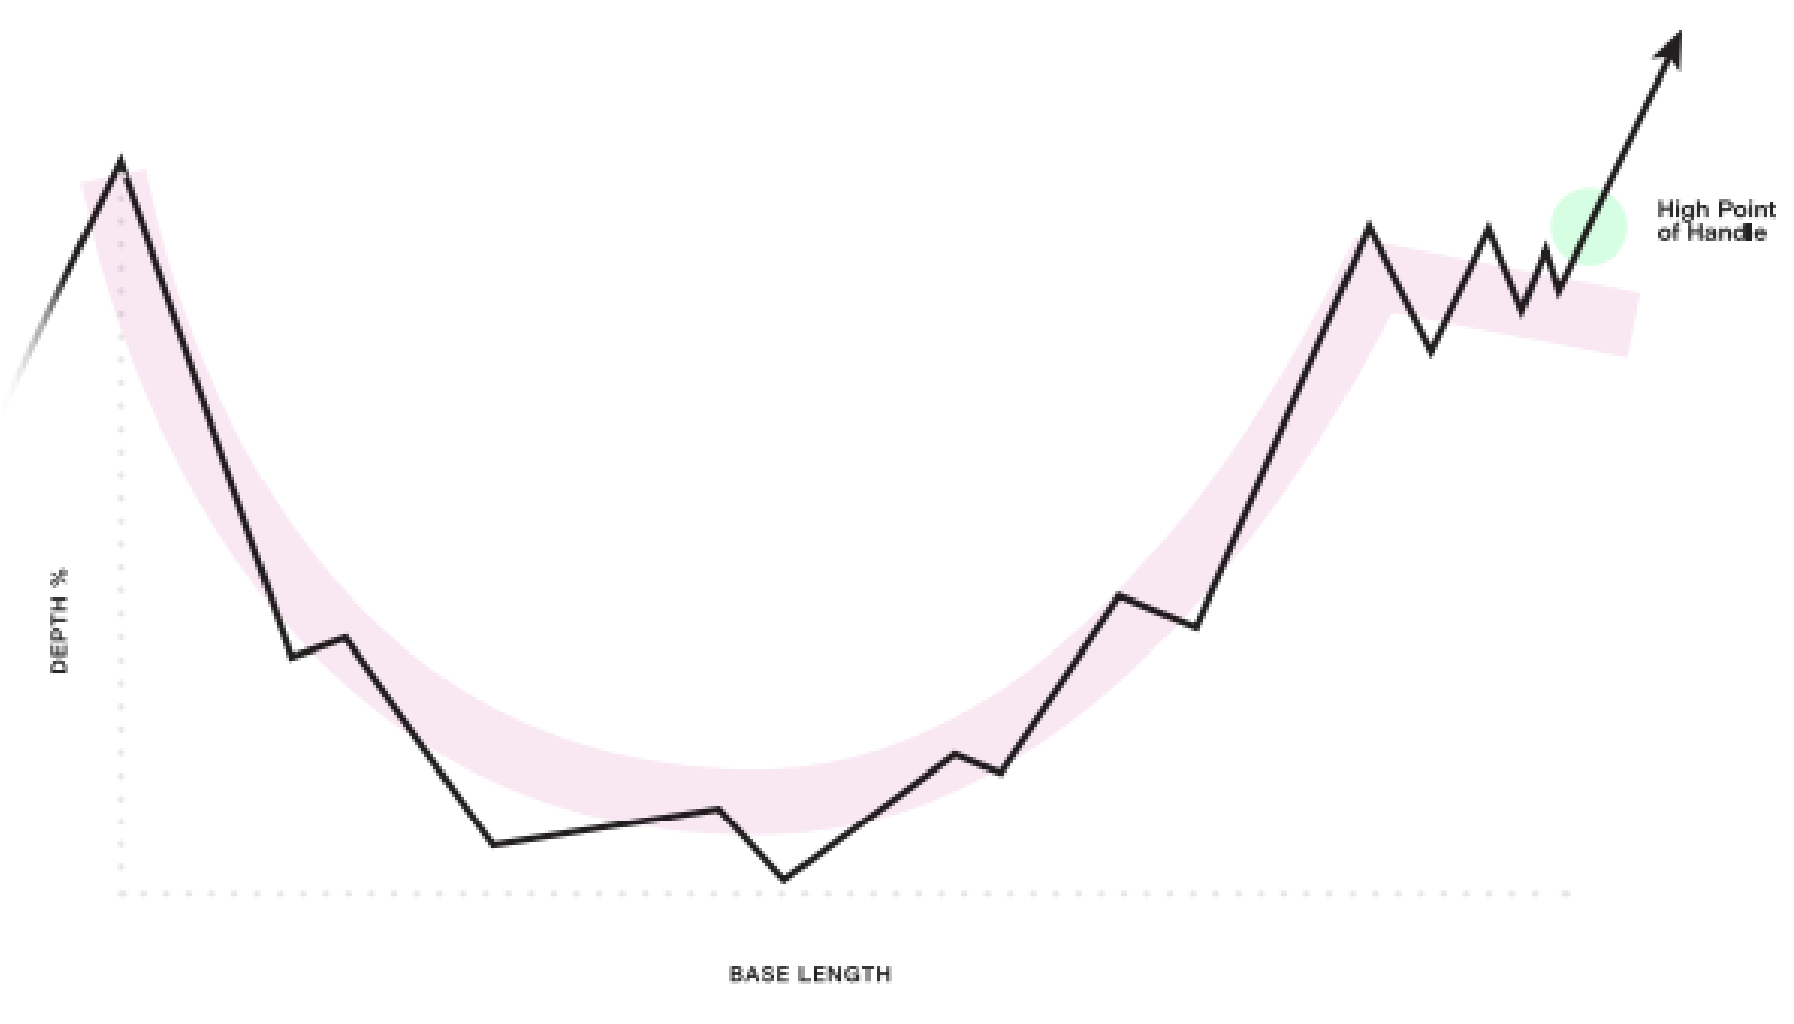
Definition: A cup and handle is a bullish continuation pattern that forms after a prior uptrend.
- Cup: A rounded consolidation, often forming a “U” shape
- Handle: A smaller, tighter consolidation near the cup’s upper edge, signaling reduced selling pressure before the breakout
Key Characteristics:
- Depth of the Cup: Ideally, no more than 30% below the prior high, but this can vary depending on market conditions
- Handle Tightness: The handle should show narrowing price action with a slight downward drift
- Breakout: Occurs when price moves above the high of the handle on increased volume

Evaluating the Cup’s Depth in Market Context
Why Context Matters:
- If the market experiences a deep correction (e.g., 30-40%), deeper cup patterns (e.g., 40-50%) are more acceptable
- In stable markets with shallow corrections, a deep cup (e.g., 50%) could indicate weakness, often referred to as a “punch bowl of death,” and might fail to breakout
Example in TTD
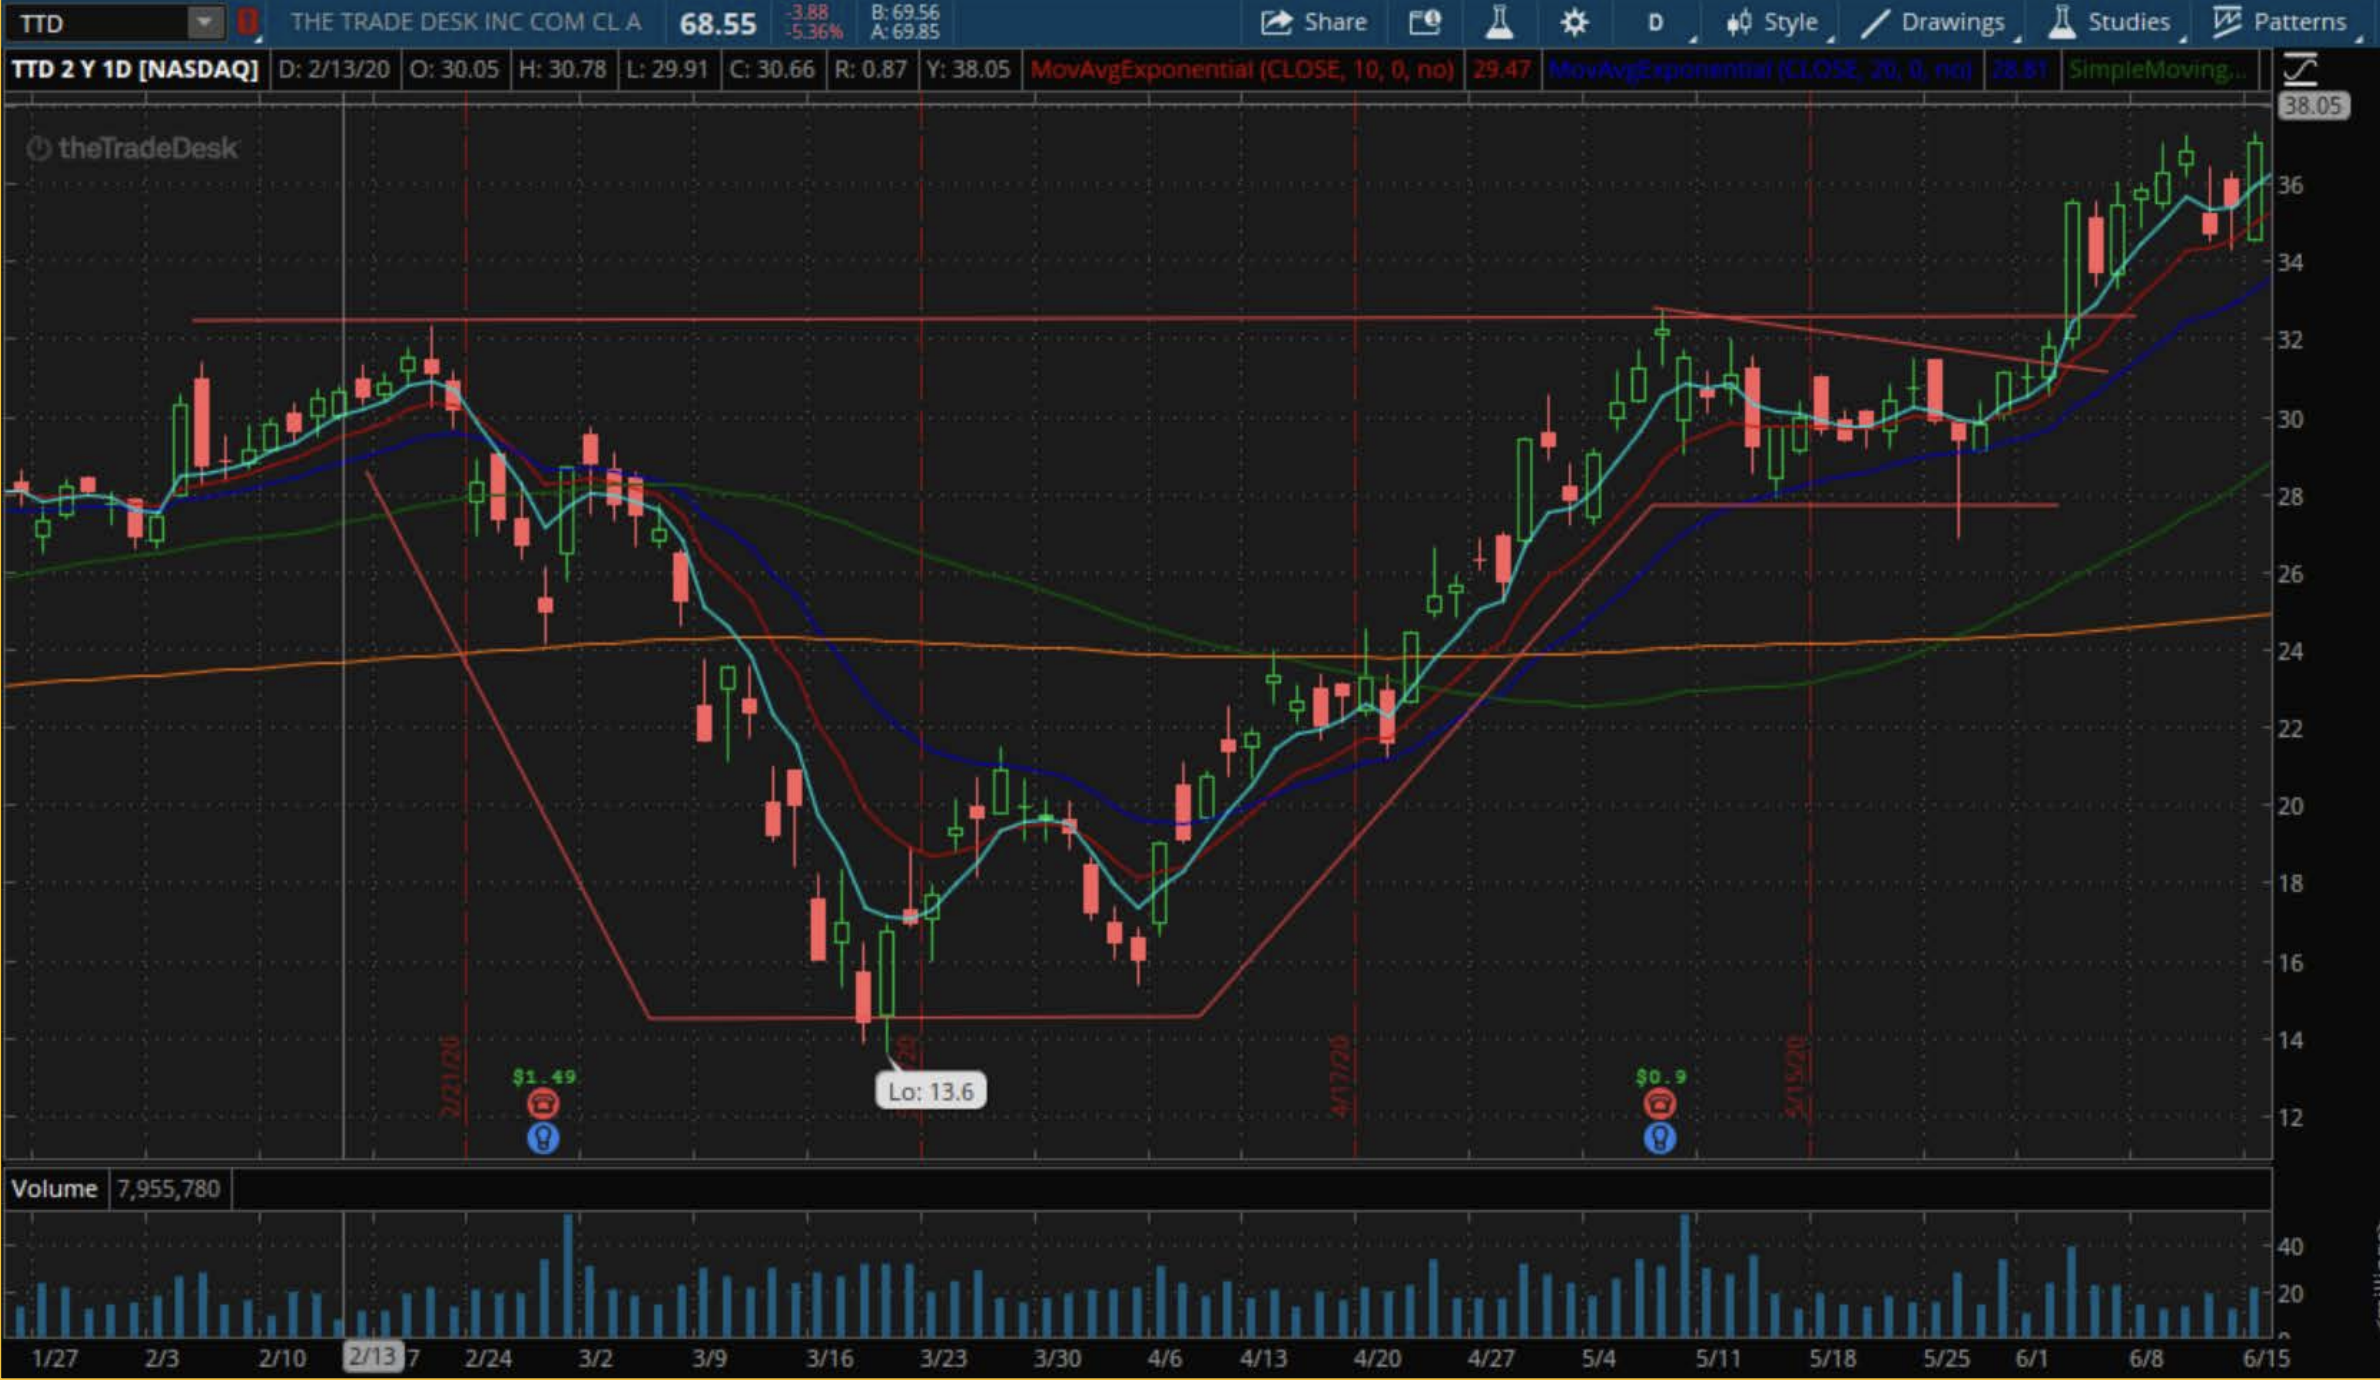
The cup depth was approximately 50%, but this was consistent with the broader market’s COVID-driven selloff. In a market with only a 10% correction, this depth would have been a red flag.

Early Entries Using the Price Cycle
Advantages of Early Entries:
- Allows traders to capture a larger portion of the move while minimizing risk
- Enables building a position before the traditional buy point, which is at the handle’s breakout
Key Price Cycle Stages in a Cup and Handle:
- Wedge Pop: Often forms near the bottom of the cup, signaling the start of accumulation
- EMA Crossback: Occurs as the stock begins climbing the right side of the cup
- Handle Formation: Typically aligns with a basin break or another consolidation pattern
Example in TTD
In TTD, the wedge pop occurred at the cup’s low, and an EMA crossback signaled the start of the right side’s climb. Traders using the price cycle could have entered early and added positions as the handle formed.
Shakeouts: A Key Signal of Institutional Support
What Is a Shakeout? A shakeout occurs when price briefly dips below a support level but quickly recovers to close higher. This action:
- Removes weak holders
- Signals institutional buying if the stock closes above the shakeout level
Example in TTD
During the handle’s formation, a shakeout occurred on the right side. Price briefly dipped but recovered to close higher, showing strong institutional demand.
Entry and Stop-Loss Strategies
Primary Buy Point:
- Enter as price breaks above the handle’s high on increased volume
Early Buy Point (Advanced):
- Enter during the wedge pop or EMA crossback for an earlier position with a tighter stop
Stop-Loss Placement:
- Place the initial stop just below the handle’s low
- For early entries, use the low of the wedge pop or the EMA crossback as the stop level
Managing the Trade
Position Management:
- Initial Entry: Begin with a smaller position at the wedge pop or EMA crossback
- Add to Position: Add during the handle’s breakout to build size
- Trail Stops: As the trade progresses, move stops higher to lock in gains
Volume Monitoring:
- Heavy volume on the breakout confirms institutional participation
- Watch for declining volume during the handle’s formation, signaling reduced selling pressure
Reflection
Why is the depth of the cup relative to market conditions a critical factor in judging the pattern’s strength?
Conclusion
The cup and handle is a timeless pattern that remains a favorite among traders. By incorporating modern techniques like the price cycle and early entries, you can refine your approach to this pattern and increase your success rate.
The strength of a cup and handle lies in its volume patterns, market context, and tight handle formation. Combine these elements with shakeouts and early entries for high-probability trades.
Action Items
- Identify stocks forming cup and handle patterns. Analyze the depth of the cup relative to recent market corrections
- Look for signs of early entries using the wedge pop and EMA crossback
- Track the stock’s breakout and evaluate the role of shakeouts in confirming institutional demand
