The Bull Snort Scan
Master the art of identifying high-volume breakouts and momentum plays with this powerful scanning technique for capturing explosive price movements
In stock trading, one of the most effective ways to identify potential winners is to track surges in trading volume, known as “Bull Snorts.” This lesson will guide you through setting up and using the Bull Snort scan to identify stocks with exceptional volume—often a sign of substantial buying interest that can signal price momentum. By the end, you’ll know how to filter stocks using the Bull Snort scan, interpret results, and make informed decisions on potential entry points.
Learning Objectives
By the end of this lesson, you will be able to:
- Understand the purpose and mechanics of the Bull Snort scan
- Set up a Bull Snort scan using criteria like volume thresholds, price, and moving averages
- Identify optimal entry points for stocks displaying Bull Snort characteristics
- Apply strategies for managing trades and determining when to exit based on volume and price movement
The Bull Snort Scan: Overview and Setup
Definition
A Bull Snort scan filters stocks that show an “enormous volume” relative to their typical trading volume, usually indicating a powerful buying or selling signal. In this context, volume serves as a “cause,” while price movement becomes the “effect” to observe.
Why Volume Matters
A surge in volume, especially several times above the daily average, often indicates a unique market event or catalyst like earnings announcements, product launches, or acquisition rumors. When volume spikes, it suggests heightened interest from institutional investors or the broader market, signaling a potential breakout or trend.
Scan Criteria
- Price Filter
Set the minimum price to $20. This avoids low-priced stocks, as stocks over $20 are typically more stable and attractive to institutional investors. - Average Daily Volume
Use an average daily volume filter of 500,000 shares. Stocks with higher daily trading volumes provide better liquidity, making it easier to enter and exit trades efficiently. - Relative Volume
Set the relative volume to over 3x. For example, if the average 50-day volume is 1 million shares, you’re looking for a daily trading volume above 3 million shares. - Moving Average Filter (Optional)
If you want to focus on stocks with established upward momentum, filter for stocks trading above their 50-day or 200-day simple moving average (SMA).

Example: Recognizing Bull Snort Patterns in Real-World Scenarios
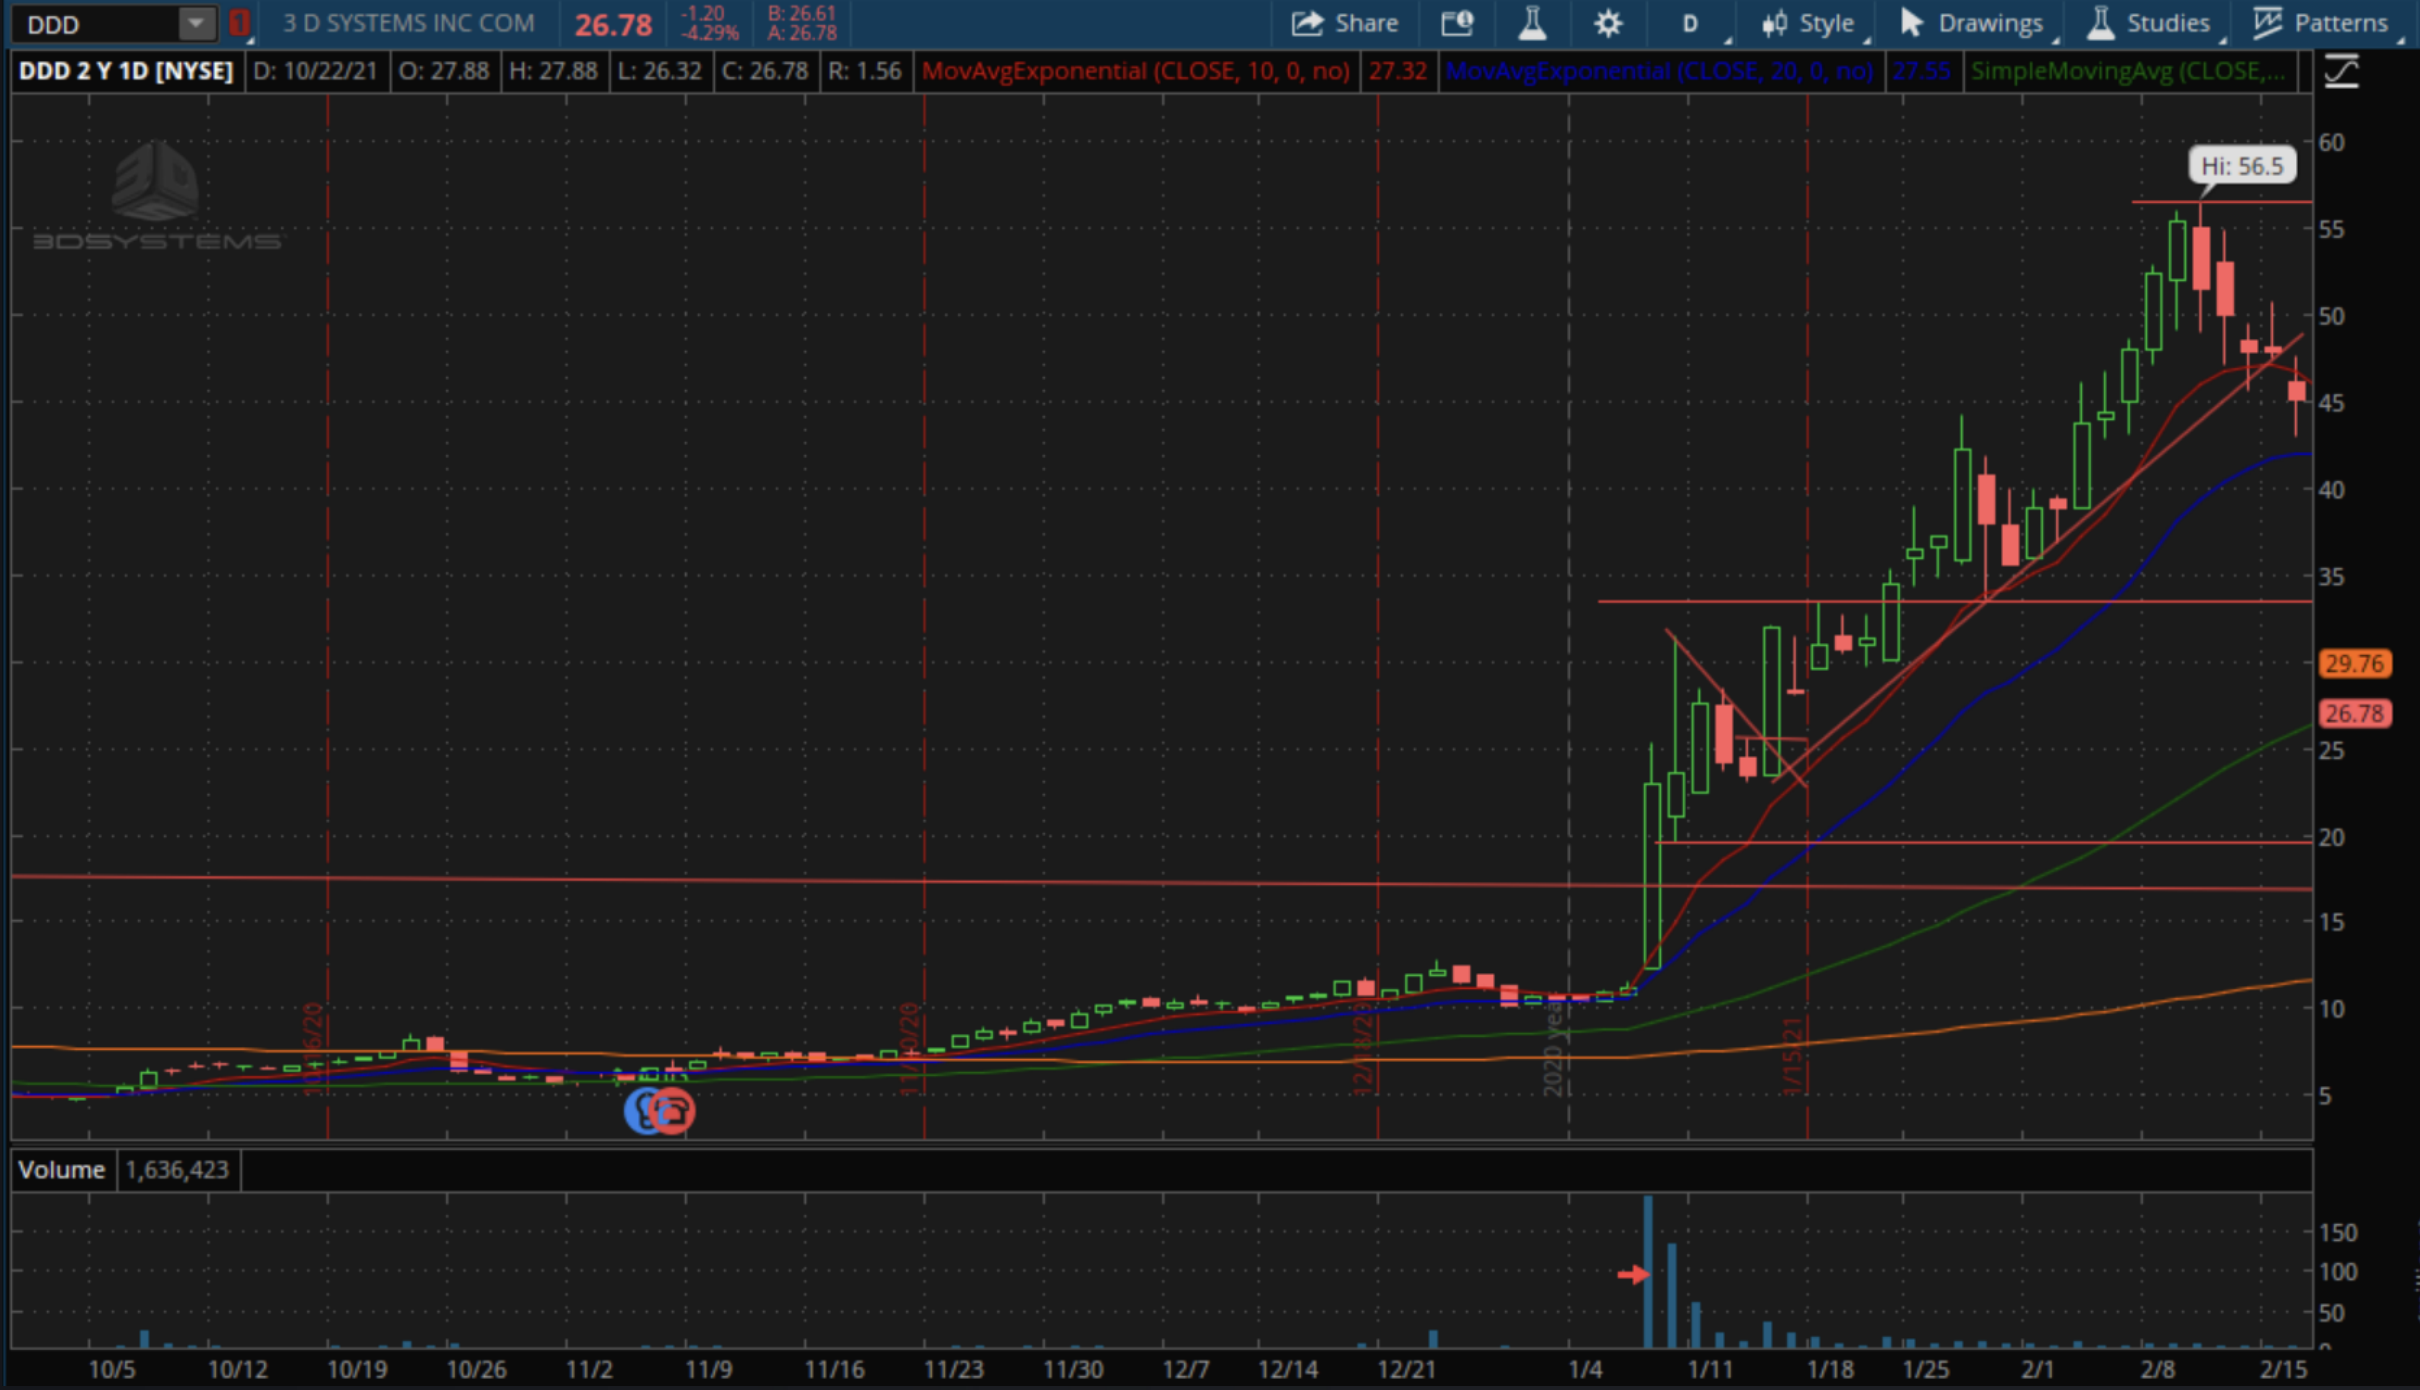
Example 1: 3D Systems (DDD)

- Catalyst: A pre-announcement that brought substantial volume, unmatched by any prior trading sessions
- Price Action: The breakout was sharp, with volume much higher than average, signaling significant buying interest
- Entry Strategy: Wait for a minor pullback or consolidation phase, then enter on a low-volume pullback or a “bull flag” formation. In this case, waiting for volume to dry up after the initial surge allowed for an entry before a sustained price rise
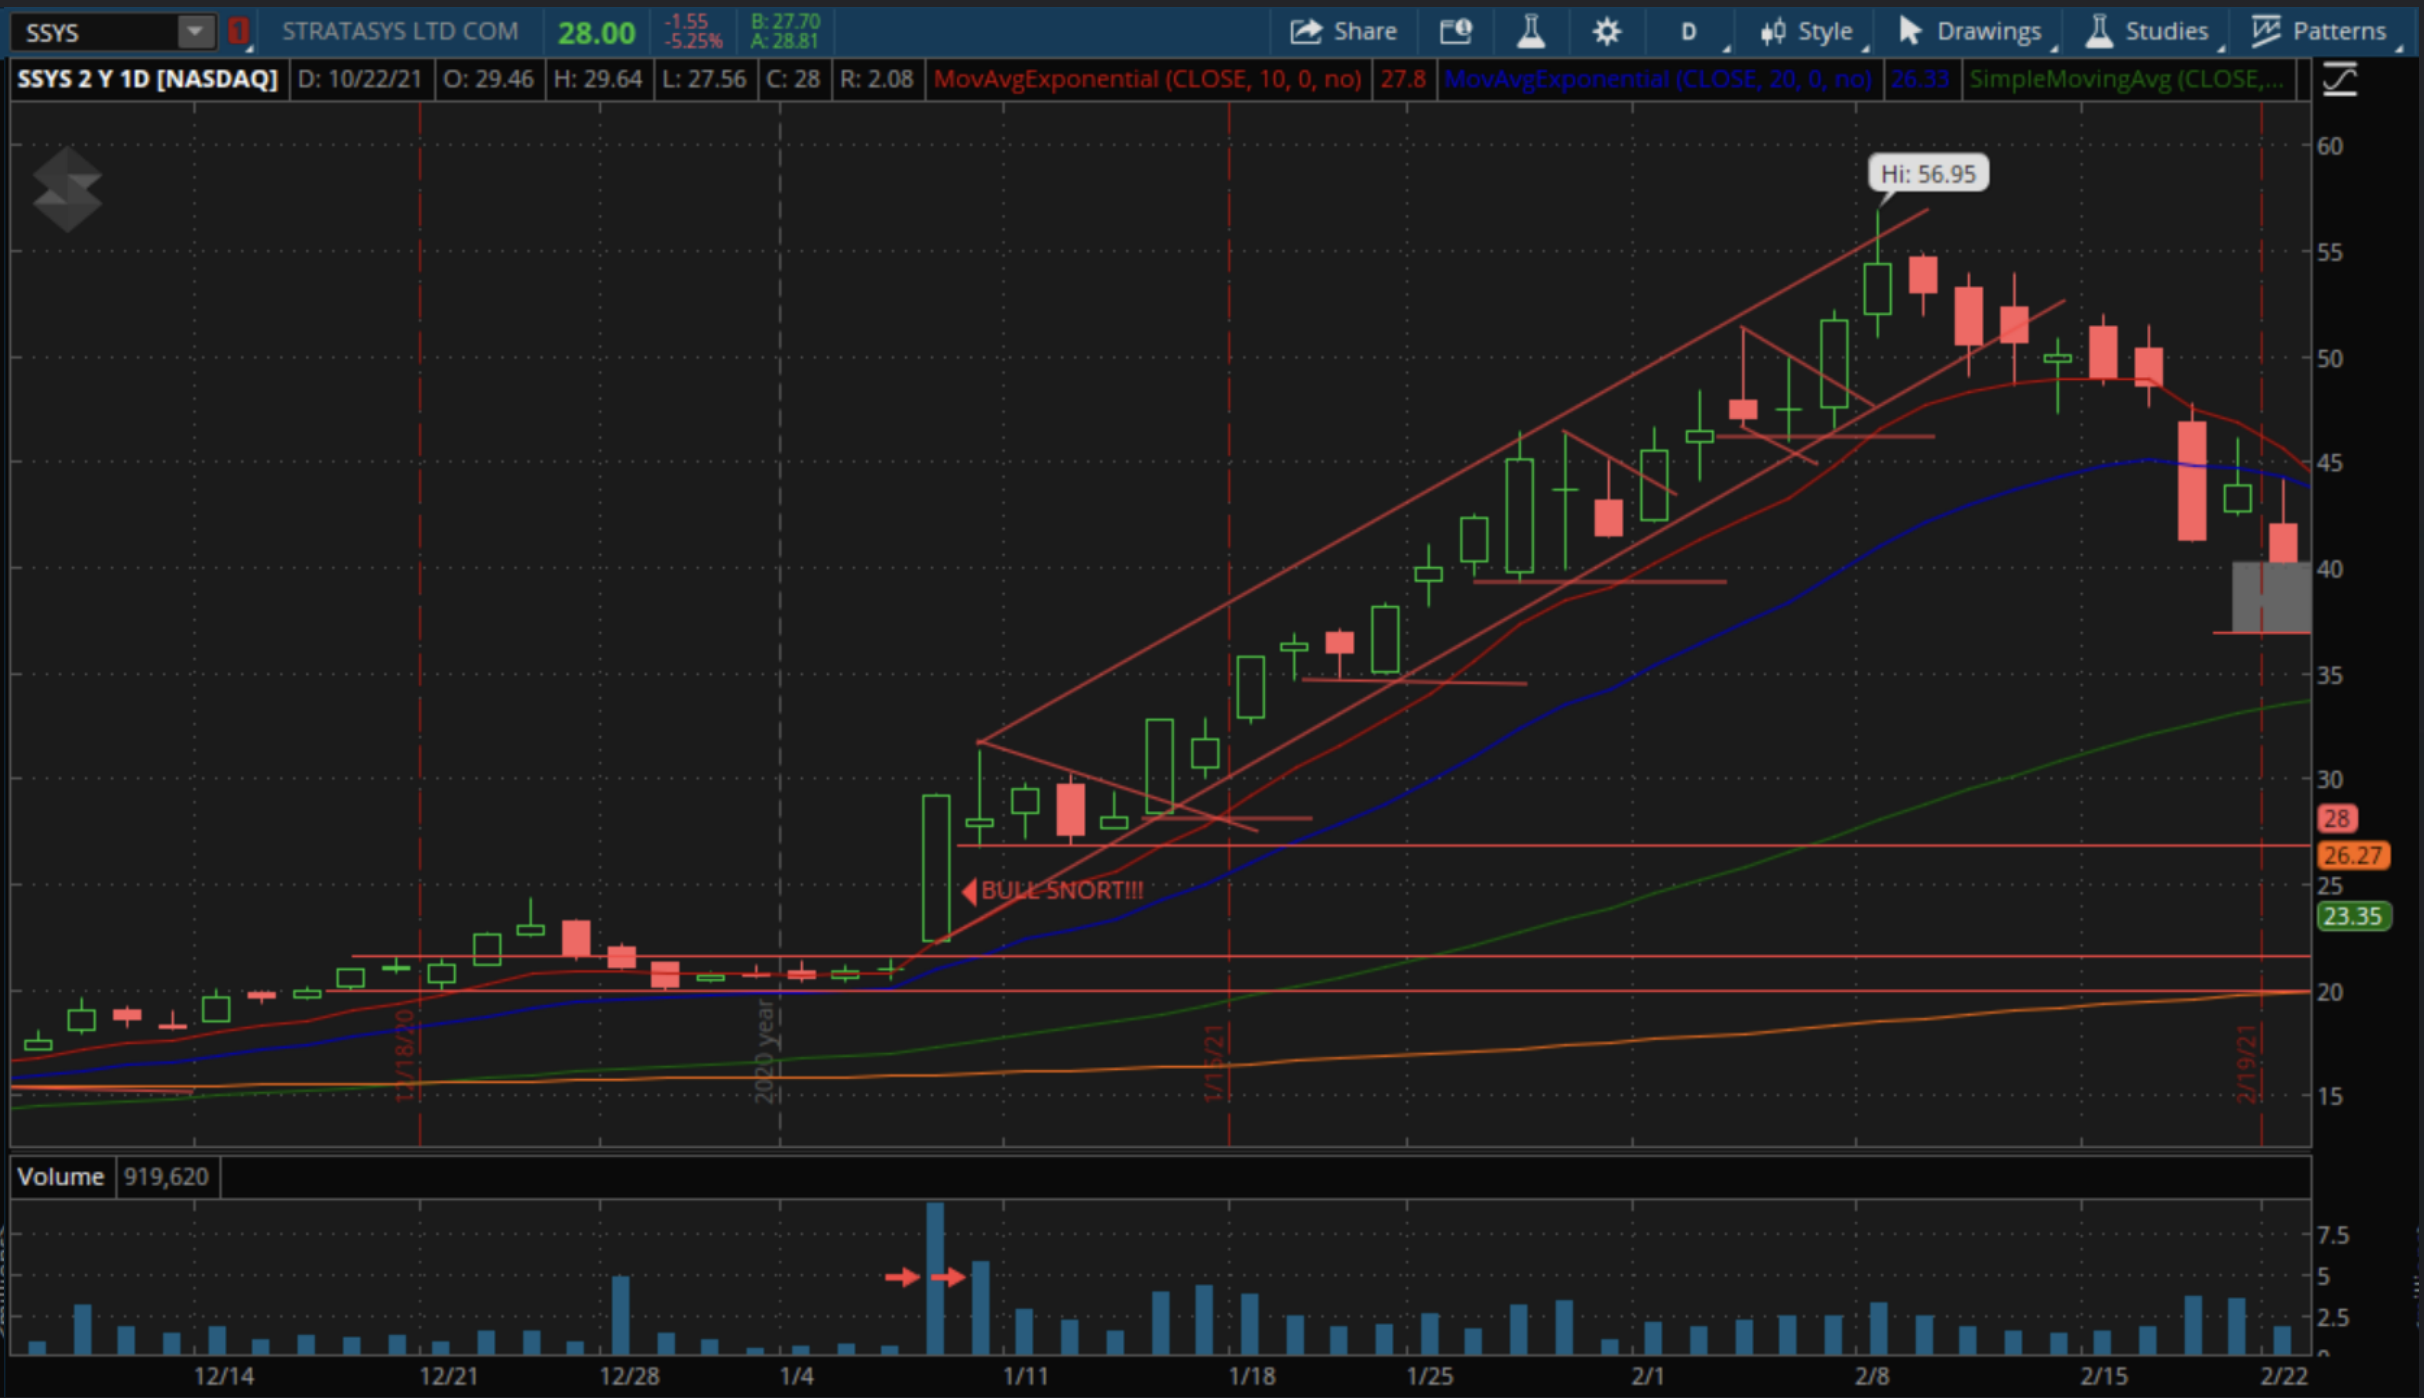
Example 2: Stratasys (SSYS)

- Catalyst: SSYS surged alongside DDD due to sector momentum
- Price Action: SSYS displayed a brief consolidation, creating an ideal “flag” pattern with low volume, making it easier to enter with controlled risk
- Outcome: After entering at the breakout, the stock increased by approximately 60% in just a few weeks, demonstrating the Bull Snort’s power to signal rapid, short-term gains
Key Entry Strategies for Bull Snort Scans
When a stock appears on the Bull Snort scan, here’s how you can determine the best time to enter:
- First-Day Entries
If you catch a stock early in the day with high volume, a first-day entry can be advantageous. Ensure you check post-market volume if trading during earnings season as this can indicate early interest. - Consolidation Patterns
Wait for a “bull flag” or similar low-volume consolidation after the initial spike. Consolidations show whether the surge is sustainable and can offer more predictable entry points. - Volume Dry-Up with Inside Bars
Look for low-volume, inside-day bars (candlesticks that stay within the previous day’s range). This pattern signals a temporary pause in momentum before another potential breakout.
Managing Exits and Sell Rules
Stocks identified through Bull Snort scans often see rapid gains, but they can also experience sharp pullbacks. Some exit strategies include:
Exit Strategies
- Trendline or Moving Average Breaks: Track the 10-day or 20-day EMA; consider selling if the stock dips below these lines, which often signals a weakening trend
- Price Action Around Resistance Levels: Use resistance from previous highs as profit-taking points, especially if the stock is overextended
Action Items
- Backtest Your Criteria: Run the scan over different historical periods, ideally around earnings seasons or major announcements, and review which stocks showed Bull Snort characteristics
Conclusion
The Bull Snort scan is a powerful tool for spotting high-potential trades based on volume, often signaling significant price movements. By understanding how to set up and interpret this scan, you can better navigate market opportunities and capture gains from strong, short-term trends. Keep practicing, refining, and using these scans as part of your routine, and you’ll sharpen your ability to spot high-momentum trades with confidence.
