Bull Flags
Master one of the most effective short-term continuation patterns for entering trades with manageable risk and reliable structure
Bull flags are one of the most effective short-term continuation patterns, offering traders a reliable structure for entering trades with manageable risk. This lesson will guide you through identifying and trading bull flags and related patterns, such as the wedge pop and EMA crossbacks. You’ll also learn how to manage stop-losses effectively to protect your capital if the trade doesn’t go as planned.
Learning Objectives
By the end of this lesson, you will be able to:
- Recognize and differentiate between bull flags and flag-like patterns on stock charts
- Use entry tactics for trading bull flags with minimal risk
- Manage stop-losses and exits to minimize losses and protect gains
- Understand the concept of buying in pieces and scaling up as the trade progresses
Understanding Bull Flags
Definition
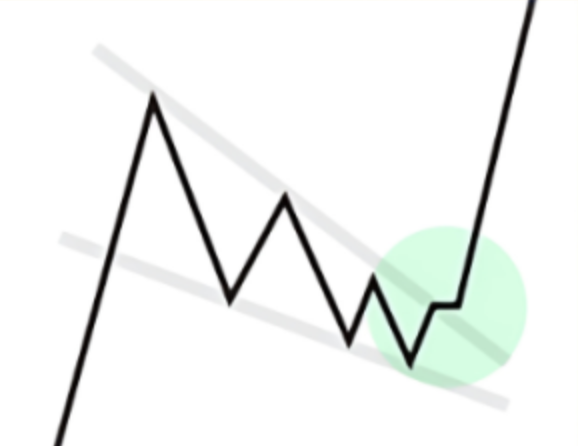
A bull flag is a short-term pattern characterized by lower highs and lower lows following a strong upward move. It represents a pause or consolidation in price, often marked by reduced volatility and lower volume. This contraction in price and volume suggests that sellers are less aggressive, creating a setup for continuation of the initial trend.
Key Characteristics of a Bull Flag
- Lower Highs and Lower Lows: Indicates a tightening in price after an upward move
- Light Volume: The pullback should ideally happen on low volume, signifying limited selling pressure
- Breakout Signal: The setup is confirmed once price breaks above the downward trendline of the flag
Example Structure of a Bull Flag: Imagine a stock moves higher on strong volume, followed by three to five days of lower highs and lower lows. A breakout above this range, especially on higher volume, signals a continuation of the trend.

The Wedge Pop and EMA Crossback
Wedge Pop: The wedge pop is another bullish setup that typically signals the beginning of an upward price cycle. This involves a breakout from a narrowing wedge pattern, often through key moving averages. The wedge pop is an ideal entry point if it occurs near long-term moving averages, indicating the stock is not overextended.
EMA Crossback: The EMA crossback involves price moving back toward the exponential moving averages (typically the 10-day or 20-day) after an initial breakout. This pattern is useful for those who may have missed the initial breakout, allowing for an entry close to a supportive moving average, which reduces risk.
Example in Action
In the Cloudflare chart example, the wedge pop occurs as the price moves above the moving averages within a larger base, setting up a potential continuation. Shortly after, a flag-like pattern forms with a pullback into the moving averages, creating an optimal entry on the EMA crossback.
Entering a Bull Flag Trade
Entry Tactics
- Primary Entry: Enter as the price breaks above the flag’s trendline on increased volume
- Alternative Entry: If aggressive, enter during the pullback near the EMA, as it shows support around these levels
- Stop-Loss Placement: Place the stop-loss just below the recent low of the bull flag. This is your “maximum pain” level, as it suggests the setup has failed if price falls below it
Managing Risk with Stop-Losses
- Initial Stop: Place the stop just below the bull flag pattern
- Tighten Stop After Breakout: If the stock closes strongly above the breakout level, consider moving your stop to just below the breakout day’s low to protect gains
- Trailing Stop After Initial Move: As the trade progresses, you can raise the stop-loss to break even or to a higher low, minimizing potential loss if the trend reverses
Example in Practice
For the Cloudflare bull flag setup, initial stops can be set just below the breakout pivot level. As the stock advances, move your stop to protect profits, especially if the stock makes a series of higher lows.
Recognizing Trade Failures and Retaking Setups
Even strong setups can fail, making it essential to be prepared to exit and re-enter if the stock re-establishes the setup.
Key Points on Handling Failures
- Quick Exits: If the stock reverses back below the breakout level, exit the trade quickly to minimize loss
- Retake Opportunities: If the stock resets and forms a similar pattern again, consider re-entering once conditions align
Example of Risk Management in Action
After entering a bull flag setup, if the price fails to follow through and drops below the initial stop, close the trade. Watch for another setup, like a second bull flag, to retry the trade if conditions improve.
Buying in Pieces and Scaling Up
Buying in Pieces: Rather than taking a full position immediately, consider entering in stages as the stock proves itself. Start with a smaller position on the initial breakout, and add to it if the trade gains momentum.
Scaling Up with a Plan
- First Buy: Enter a small position on the wedge pop or bull flag breakout
- Second Buy: Add to the position if the price holds the breakout level and continues upward
- Stop-Loss Adjustments: As you increase your position, tighten your stop-loss levels accordingly to reduce risk
Example Strategy
On Cloudflare, the initial buy could occur on the wedge pop or the EMA crossback. Add to the position as the stock breaks out from the bull flag, adjusting stops with each addition.
Conclusion
Bull flags and related setups offer high-probability entry opportunities when managed carefully. By recognizing these patterns and using strategic entry and exit tactics, you can capture upside potential while controlling risk. Remember to maintain flexibility: even a great setup can fail, so be prepared to exit and re-enter if conditions align again.
Action Items
- Find a stock with a bull flag pattern and identify an entry point, initial stop-loss, and target
- Track the trade’s progression, adjusting stops as the stock moves in your favor
