Flat Base Trading Patterns
Master flat base consolidation patterns and learn to identify explosive breakout opportunities with proper volume analysis and institutional accumulation signals
Flat bases are consolidation patterns that provide an excellent setup for explosive moves when a stock breaks out. Unlike short-term patterns like flags or wedges, flat bases can range from several weeks to years, creating a foundation for significant price advances. This lesson focuses on identifying, entering, and managing flat base setups, with a particular emphasis on the importance of shakeouts and volume clues.
Learning Objectives
By the end of this lesson, you will be able to:
- Identify flat bases and understand the importance of their size and duration
- Recognize key volume patterns that signal institutional accumulation
- Develop entry strategies for flat base breakouts and secondary setups
- Use shakeouts and catalysts to build conviction in trades
What Is a Flat Base?
Definition
A flat base is a consolidation pattern where a stock trades within a relatively tight range following an advance. It reflects a pause as the stock builds strength for its next move higher.
Key Characteristics
- Length: Flat bases can last from five weeks to multiple years
- Volume Decline: Volume often decreases as the base develops, signaling reduced selling pressure
- Shakeouts: Temporary dips below key levels can shake out weak holders, strengthening the pattern
- Breakout Volume: A strong breakout is often accompanied by heavy volume, confirming institutional buying

Recognizing Strong Flat Bases
Volume Patterns
- Look for declining volume as the base develops, signaling reduced selling pressure
- Watch for bursts of buying volume during rallies within the base or shakeouts, indicating institutional support
Shakeouts
Shakeouts occur when price temporarily dips below the base’s support level but recovers to close higher. These events:
- Remove weak holders
- Indicate strong demand if institutions buy the dip and push the stock back up
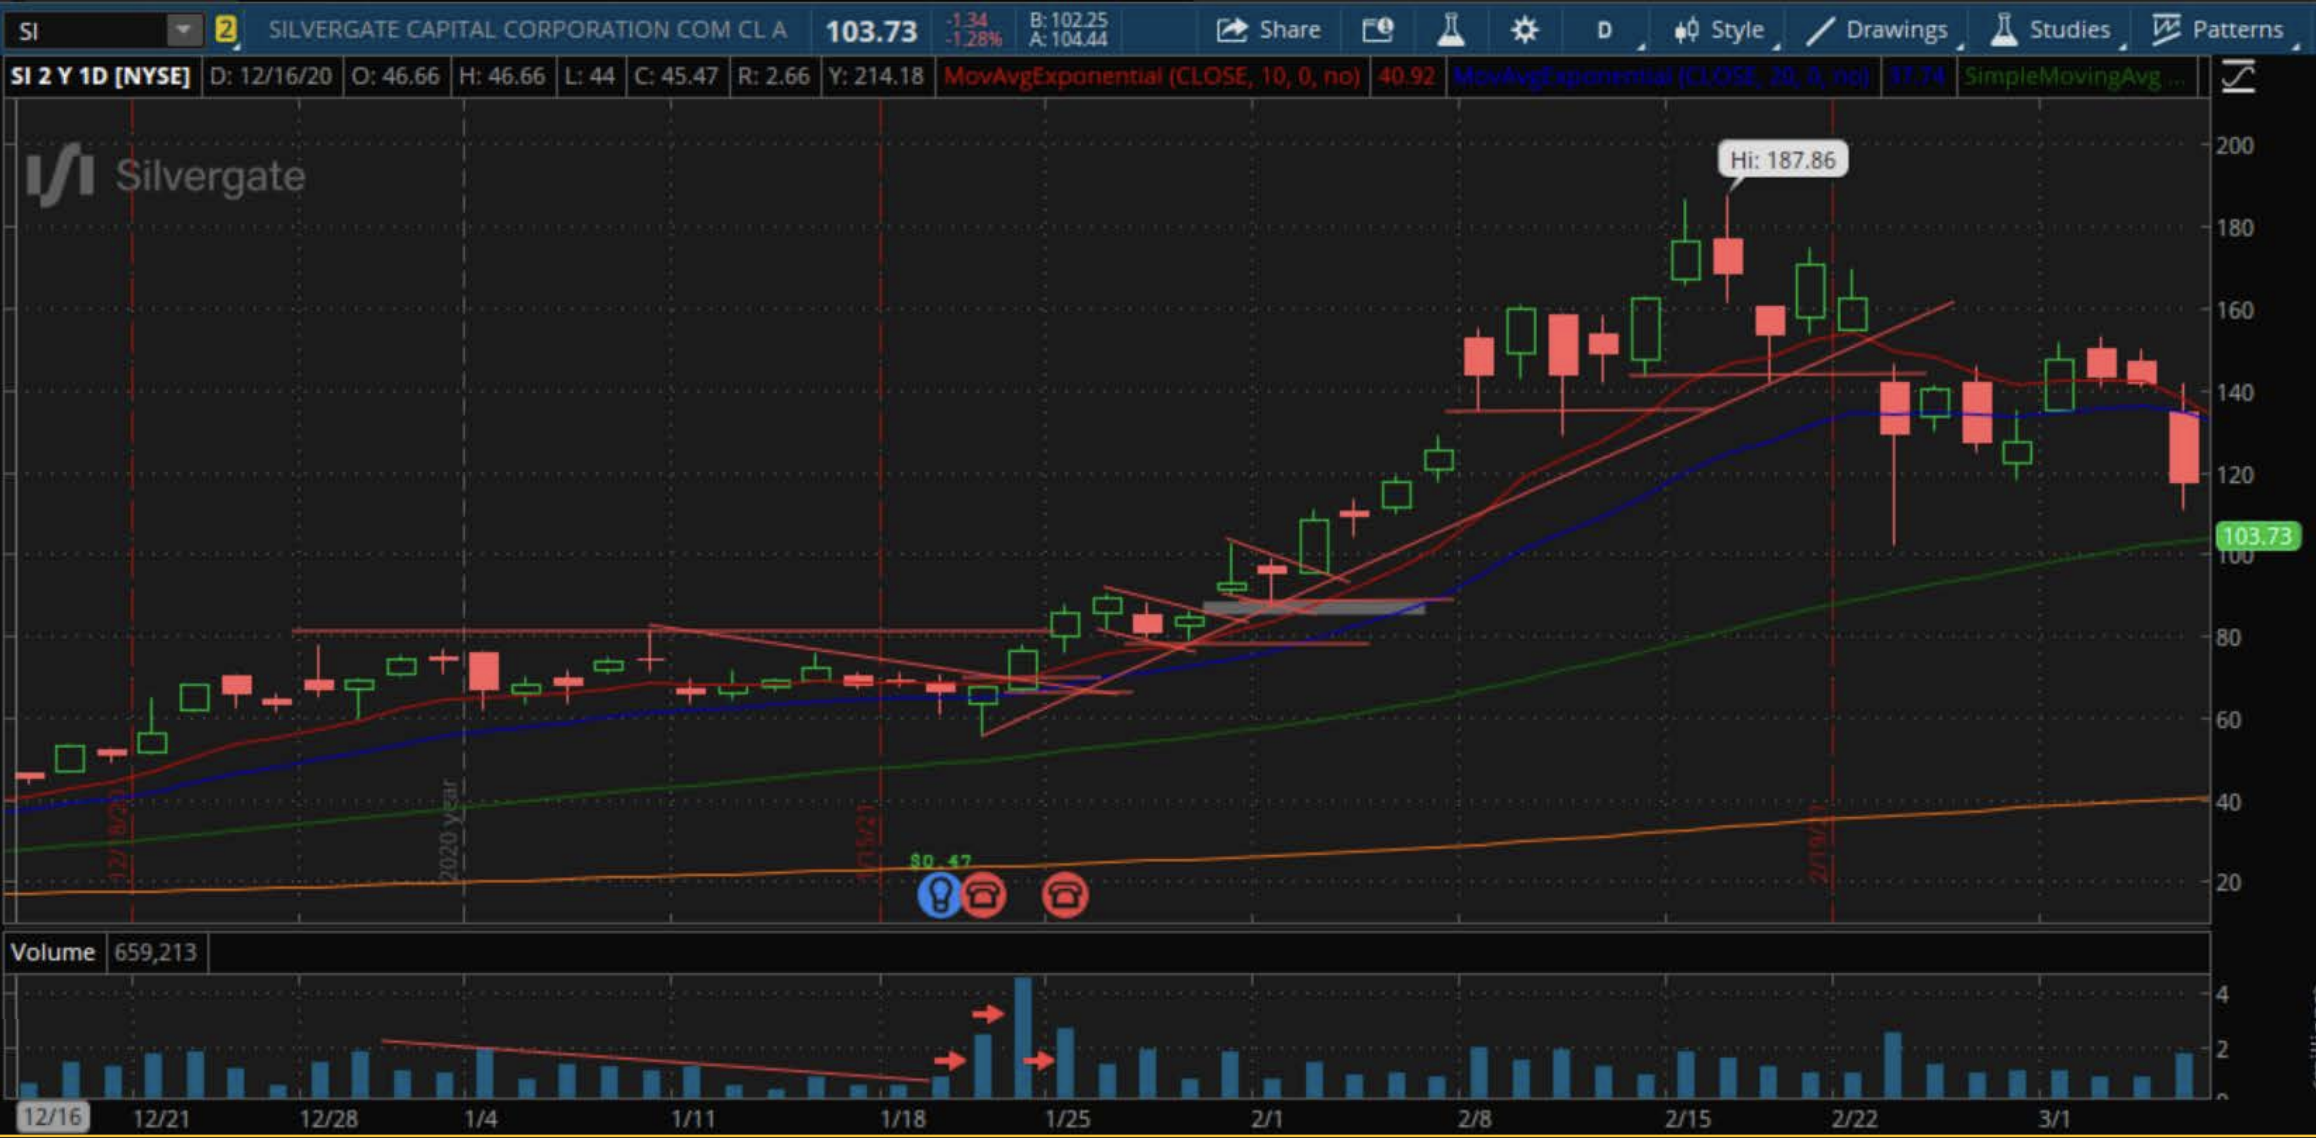
Example in Silvergate (SI)
- A flat base developed over 4-5 weeks after a strong prior move
- During the base, volume declined, and a shakeout occurred, undercutting most of the base’s price action
- Institutions absorbed the shares, as evidenced by a recovery and close above the shakeout level

Entry Strategies for Flat Bases
Primary Entry Points
- Breakout Entry: Buy as the stock breaks above the high of the flat base with strong volume
- Early Entry: For savvy traders, enter when the stock clears a descending trendline within the base
Secondary Entries
- If you miss the initial breakout, look for a secondary consolidation (e.g., a bull flag or wedge pop) near the breakout level to add or initiate a position
Example in Silvergate (SI)
- The first entry occurred as the stock broke a descending trendline within the base, accompanied by strong volume
- A secondary opportunity arose with a bull flag breakout shortly after the initial move
Catalysts and Shakeouts: Building Conviction
The Role of Catalysts
Catalysts like earnings or secondary offerings often provide additional conviction for flat base breakouts.
Example
In Silvergate, the stock experienced an earnings announcement followed by a secondary offering. Institutions absorbed the shares from the offering, pushing the price higher—a clear sign of demand.
Shakeouts as Signals
- A shakeout that closes above the low signals strong institutional support
- Patterns with shakeouts are often more reliable, as weak holders are removed, and only committed buyers remain
Managing Flat Base Trades
Position Management
- Start with a smaller position at the breakout
- Add to the position if the stock consolidates and breaks out again (e.g., bull flag near the breakout level)
- Raise your stop-loss as the stock progresses to lock in gains
Stop-Loss Placement
- Place the initial stop just below the flat base’s low
- Adjust stops higher as the trade works in your favor
Example in Silvergate
- The first stop was placed below the flat base
- After the breakout, the stop was raised to below the bull flag consolidation
Reflection
How does the presence of a shakeout within a flat base increase the reliability of the breakout?
Conclusion
Flat bases are powerful setups that often lead to significant price moves, particularly when supported by strong volume, shakeouts, and catalysts. By focusing on the base’s structure and accumulation patterns, you can confidently enter trades with a clear edge.
The quality of a flat base lies in its volume patterns and the presence of shakeouts. Combine these signals with a strong breakout to identify high-probability trades.
Action Items
- Find stocks that have been consolidating for 5 weeks or longer. Analyze their volume patterns and look for signs of institutional accumulation
- Watch for catalysts, such as earnings or announcements, that may trigger a breakout
- Track the stock’s performance post-breakout and refine your strategy for identifying early entries and managing risk
