Descending Wedges
Master continuation patterns with tightening price action – learn to recognize reduced selling pressure and capitalize on high-probability breakouts with optimal position management
Descending wedges are continuation patterns similar to descending channels but with a key difference: the tightening of price action. As lower highs and lower lows form, the lows become less pronounced, indicating waning selling pressure and increased buyer interest. This session will teach you how to recognize and trade descending wedges for precise entries and optimal position management.
Learning Objectives
By the end of this lesson, you will be able to:
- Identify descending wedges and understand their differences from descending channels
- Recognize key signs of buyer accumulation within the pattern
- Develop entry and stop-loss strategies for descending wedges
- Use pyramiding techniques to maximize gains with minimal additional risk
What Is a Descending Wedge?
Definition
A descending wedge is a continuation pattern with lower highs and lower lows, where the lows become less pronounced over time. This tightening of price action signals reduced selling pressure and an eventual breakout to the upside.
Key Characteristics
- Converging Trendlines: Both the upper and lower trendlines slope downward, but the lower trendline flattens out, creating a tightening effect
- Reduced Selling Pressure: Sellers struggle to push prices significantly lower as buyers become more active
- Volume Behavior: Declining volume throughout the pattern is typical, with occasional volume spikes during key supportive price moves
Example: DigitalOcean
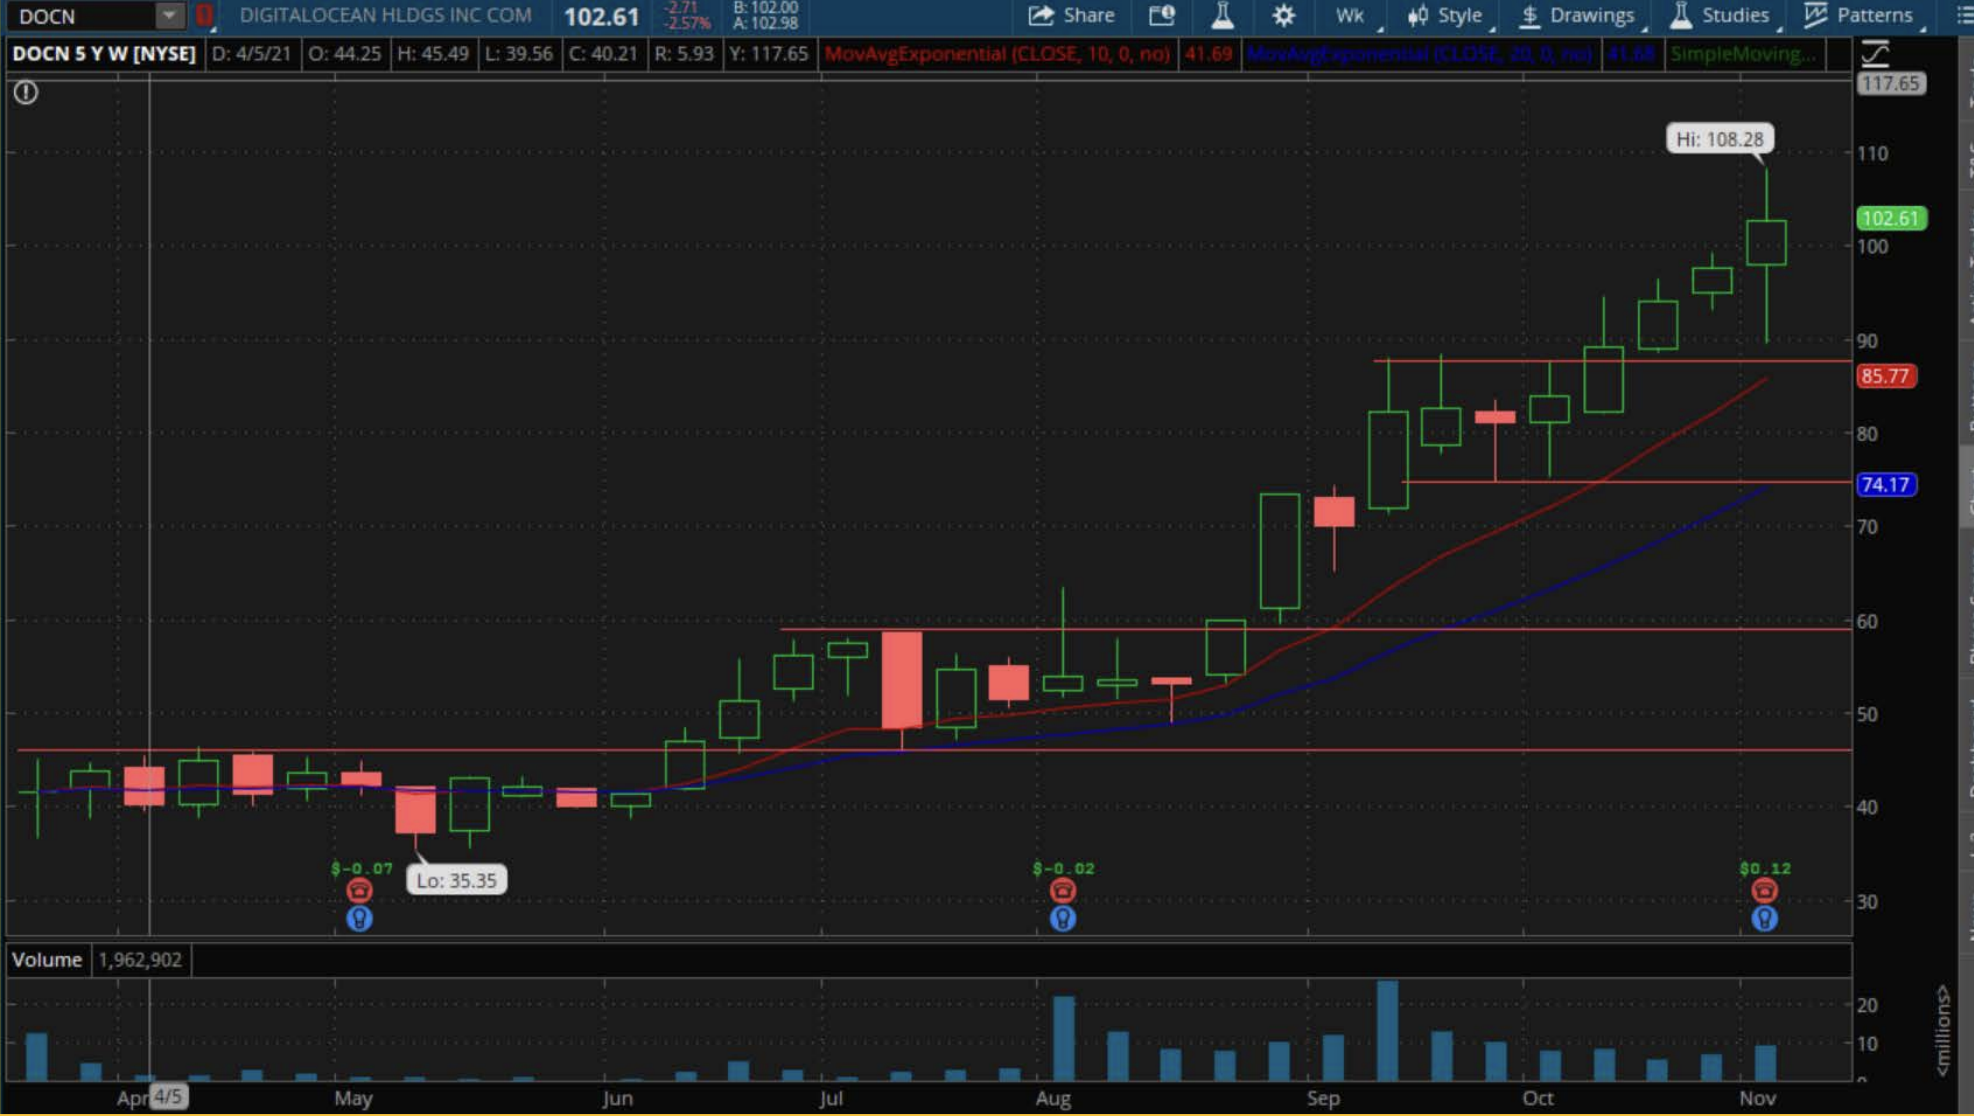
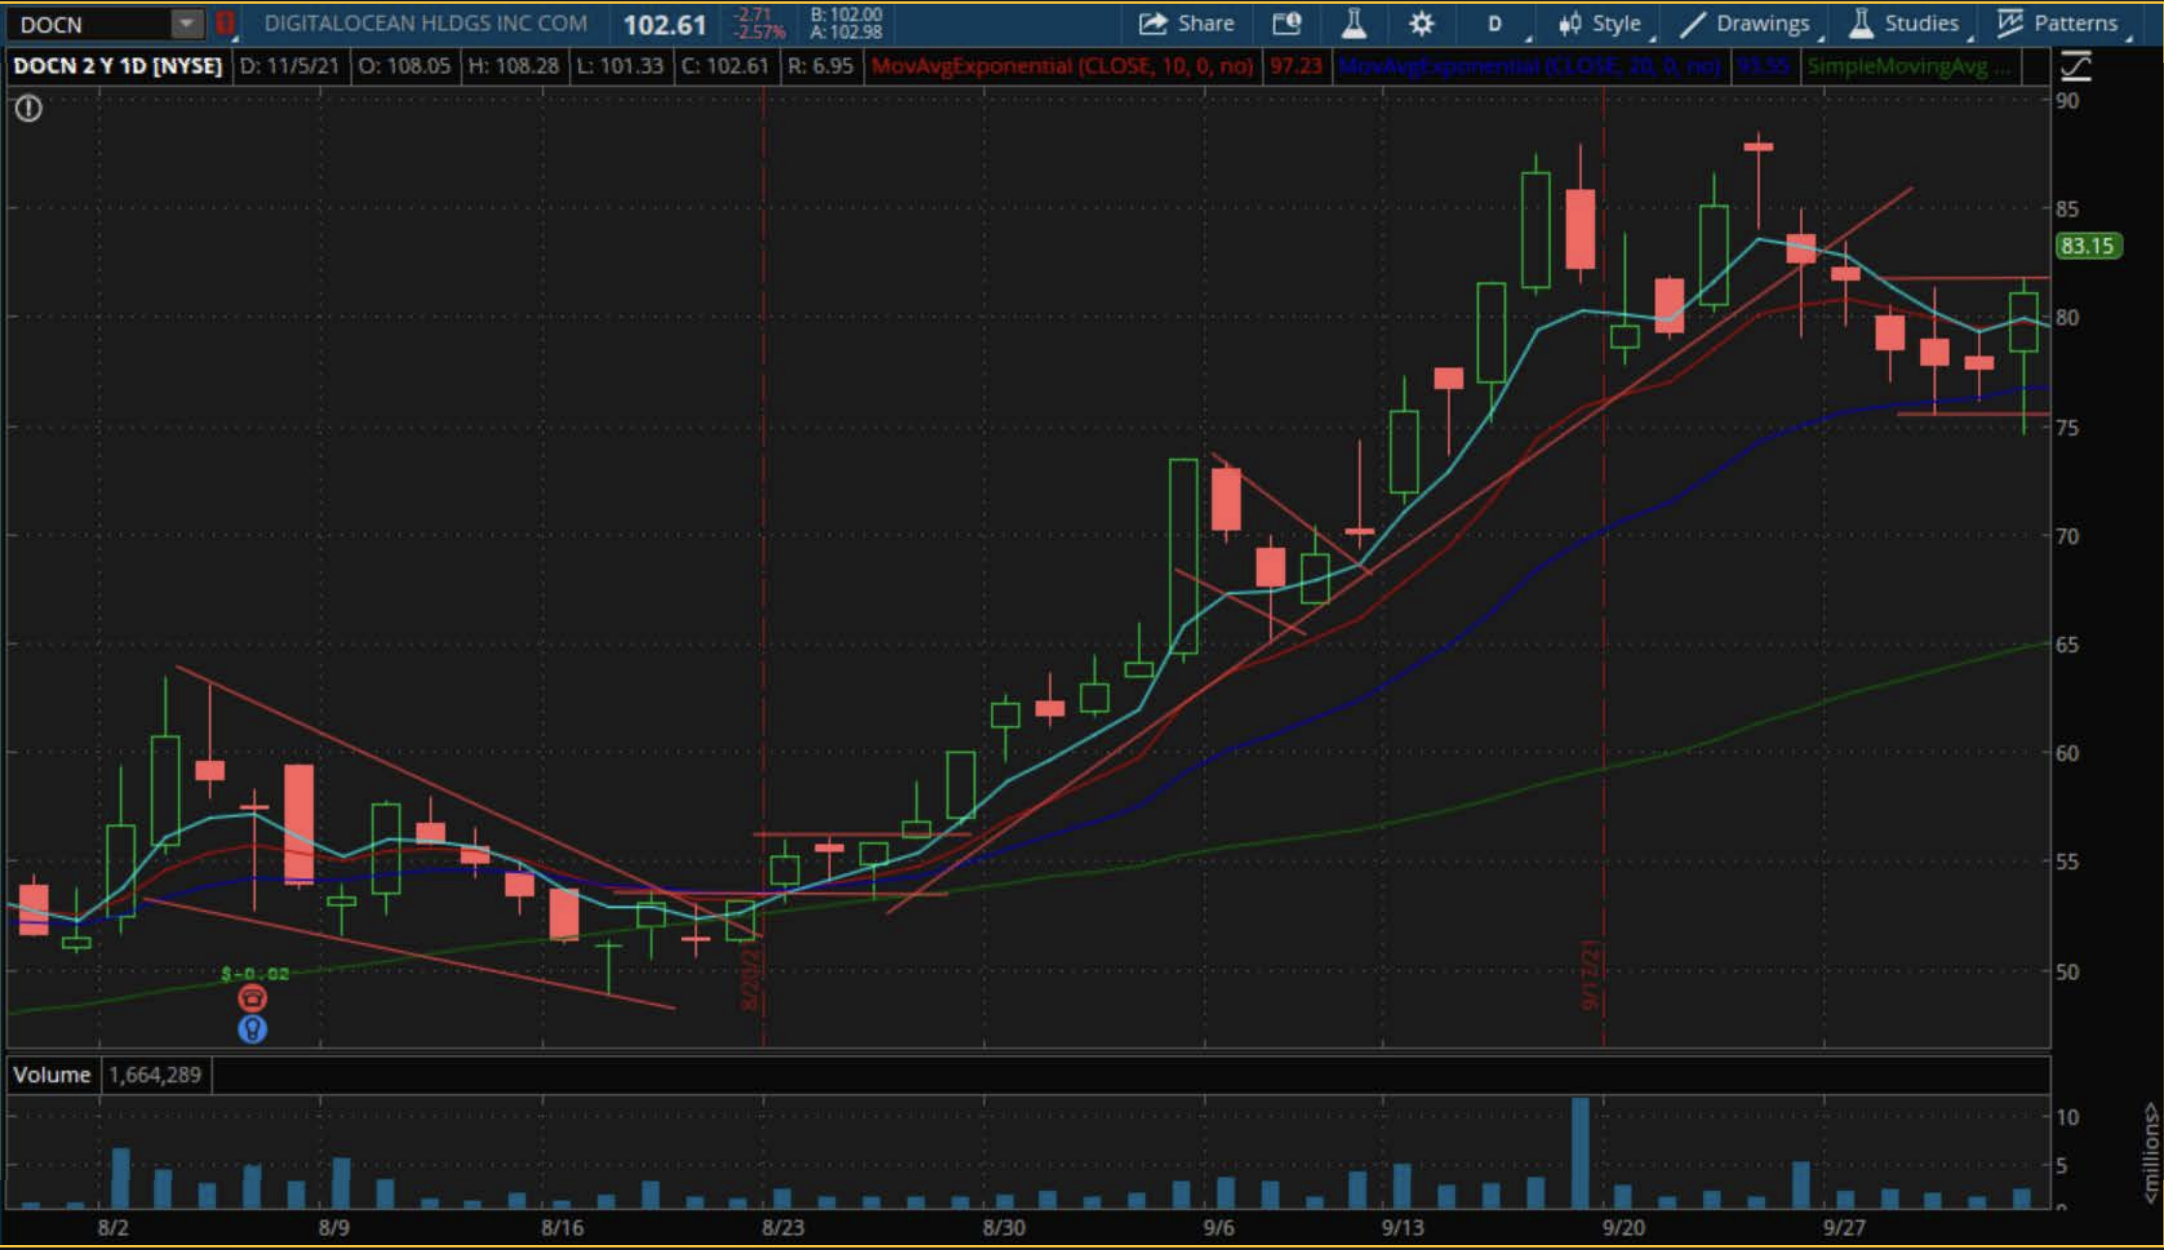
In DigitalOcean, a descending wedge formed over several weeks. Buyers repeatedly supported the stock at lower levels, with small rallies after each new low. This pattern culminated in a wedge pop that triggered the breakout.

Recognizing Signs of Accumulation
Change in Character
The key to identifying the end of a descending wedge is spotting moments when buyers step in aggressively:
- Support at Lower Lows: Each new low sees less downward follow-through as buyers absorb selling pressure
- Bullish Reversals: Watch for bars that take out the prior low but close higher, signaling buyer strength
Example in DigitalOcean
- At multiple points, price made new lows but quickly reversed higher
- Each reversal signaled increasing buyer strength and diminishing seller influence
Entry Strategies for Descending Wedges
Primary Entry Point: The Wedge Pop
- The wedge pop occurs when price breaks above the descending trendline and key moving averages (e.g., the 10-day or 20-day EMA)
- Entry Trigger: Buy as price clears the trendline on an increase in volume or after a supportive bullish reversal bar
Additional Entries (Pyramiding)
- Pullback Entry: If the stock forms a tight range or small flag after the wedge pop, add to your position as it breaks out of this consolidation
- Secondary Breakout: Add shares as the stock clears a new pivot point shortly after the initial breakout
Stop-Loss Placement
- Place your initial stop just below the low of the wedge
- As the stock moves higher, raise your stop to lock in gains
Example in DigitalOcean
- Enter on the wedge pop when price clears the trendline
- Add to your position when price consolidates tightly and breaks out again
- Adjust stops higher as the stock moves in your favor
Building Conviction Through Volume Patterns
Inside the Pattern
- Study volume throughout the wedge, not just on the breakout day
- Look for:
- Positive Volume Days: Days with significant buying (up days with high volume)
- Dry Volume on Pullbacks: Indicates sellers are running out of momentum
Breakout Confirmation
While the breakout day itself may not have explosive volume, prior accumulation within the wedge builds confidence that institutions are supporting the stock.
Volume Analysis Example
In DigitalOcean, supportive volume appeared throughout the wedge. The breakout was accompanied by modest volume, but the weeks of accumulation preceding it provided the real edge.

Pyramiding for Big Gains
What Is Pyramiding?
Pyramiding involves adding to a winning position in stages, using gains from earlier entries to reduce the risk of subsequent buys.
Key Steps
- Enter the initial position on the wedge pop
- Add during subsequent consolidations (e.g., tight ranges or small bull flags)
- Raise your stop with each addition to ensure risk remains manageable
Example in DigitalOcean
- Initial Buy: Enter on the wedge pop
- First Add: Add shares when price consolidates tightly after the breakout
- Second Add: Add again as the stock clears a secondary pivot, while raising stops on earlier positions
Reflection
How does the flattening of lower lows in a descending wedge signal reduced selling pressure?
Conclusion
Descending wedges offer a clear, low-risk structure for identifying high-probability breakouts. By focusing on accumulation patterns, price tightening, and volume clues, traders can capitalize on these setups effectively.
Descending wedges signal the end of selling pressure and the beginning of buyer dominance. Combine this pattern with pyramiding techniques to maximize gains while keeping risk under control.
Action Items
- Find three stocks forming descending wedges. Study their price and volume behavior over several weeks
- Document potential entry points, stop-loss levels, and pyramiding opportunities
- Track the outcomes of these setups to refine your approach to trading wedges
