Identifying Relative Strength in Down Markets
Discover how to spot high-potential stocks that show resilience during market downturns and position yourself ahead of institutional investors
In this lesson, we’re focusing on one of the most promising strategies to identify potential high-performing stocks: spotting strength in market downturns. When the broader market trends downward, certain stocks show resilience by holding steady or even rising. This relative strength can be an early indicator of significant growth potential once the market stabilizes. By the end of this lesson, you’ll understand how to scan for these opportunities and use relative strength as a way to identify stocks that institutions may be quietly accumulating.
Learning Objectives
By the end of this lesson, you will be able to:
- Define “relative strength” and explain why it’s valuable in stock selection
- Use scans to identify stocks displaying positive performance in a declining market
- Recognize specific chart patterns that signal institutional buying
- Apply this knowledge to identify high-potential stocks in future market corrections
Understanding Relative Strength in Down Markets
- What is Relative Strength? Relative strength is a stock’s ability to perform better than the market, particularly during a market downturn. When most stocks are falling, those that maintain or increase in price signal potential buying interest from institutional investors.
- Why Focus on Down Days? Running scans on down days helps filter out stocks with inherent strength, likely driven by institutional buying. Avoid scanning on days when the overall market is up, as the list will be saturated with positive performers, making it difficult to pinpoint the strongest ones.
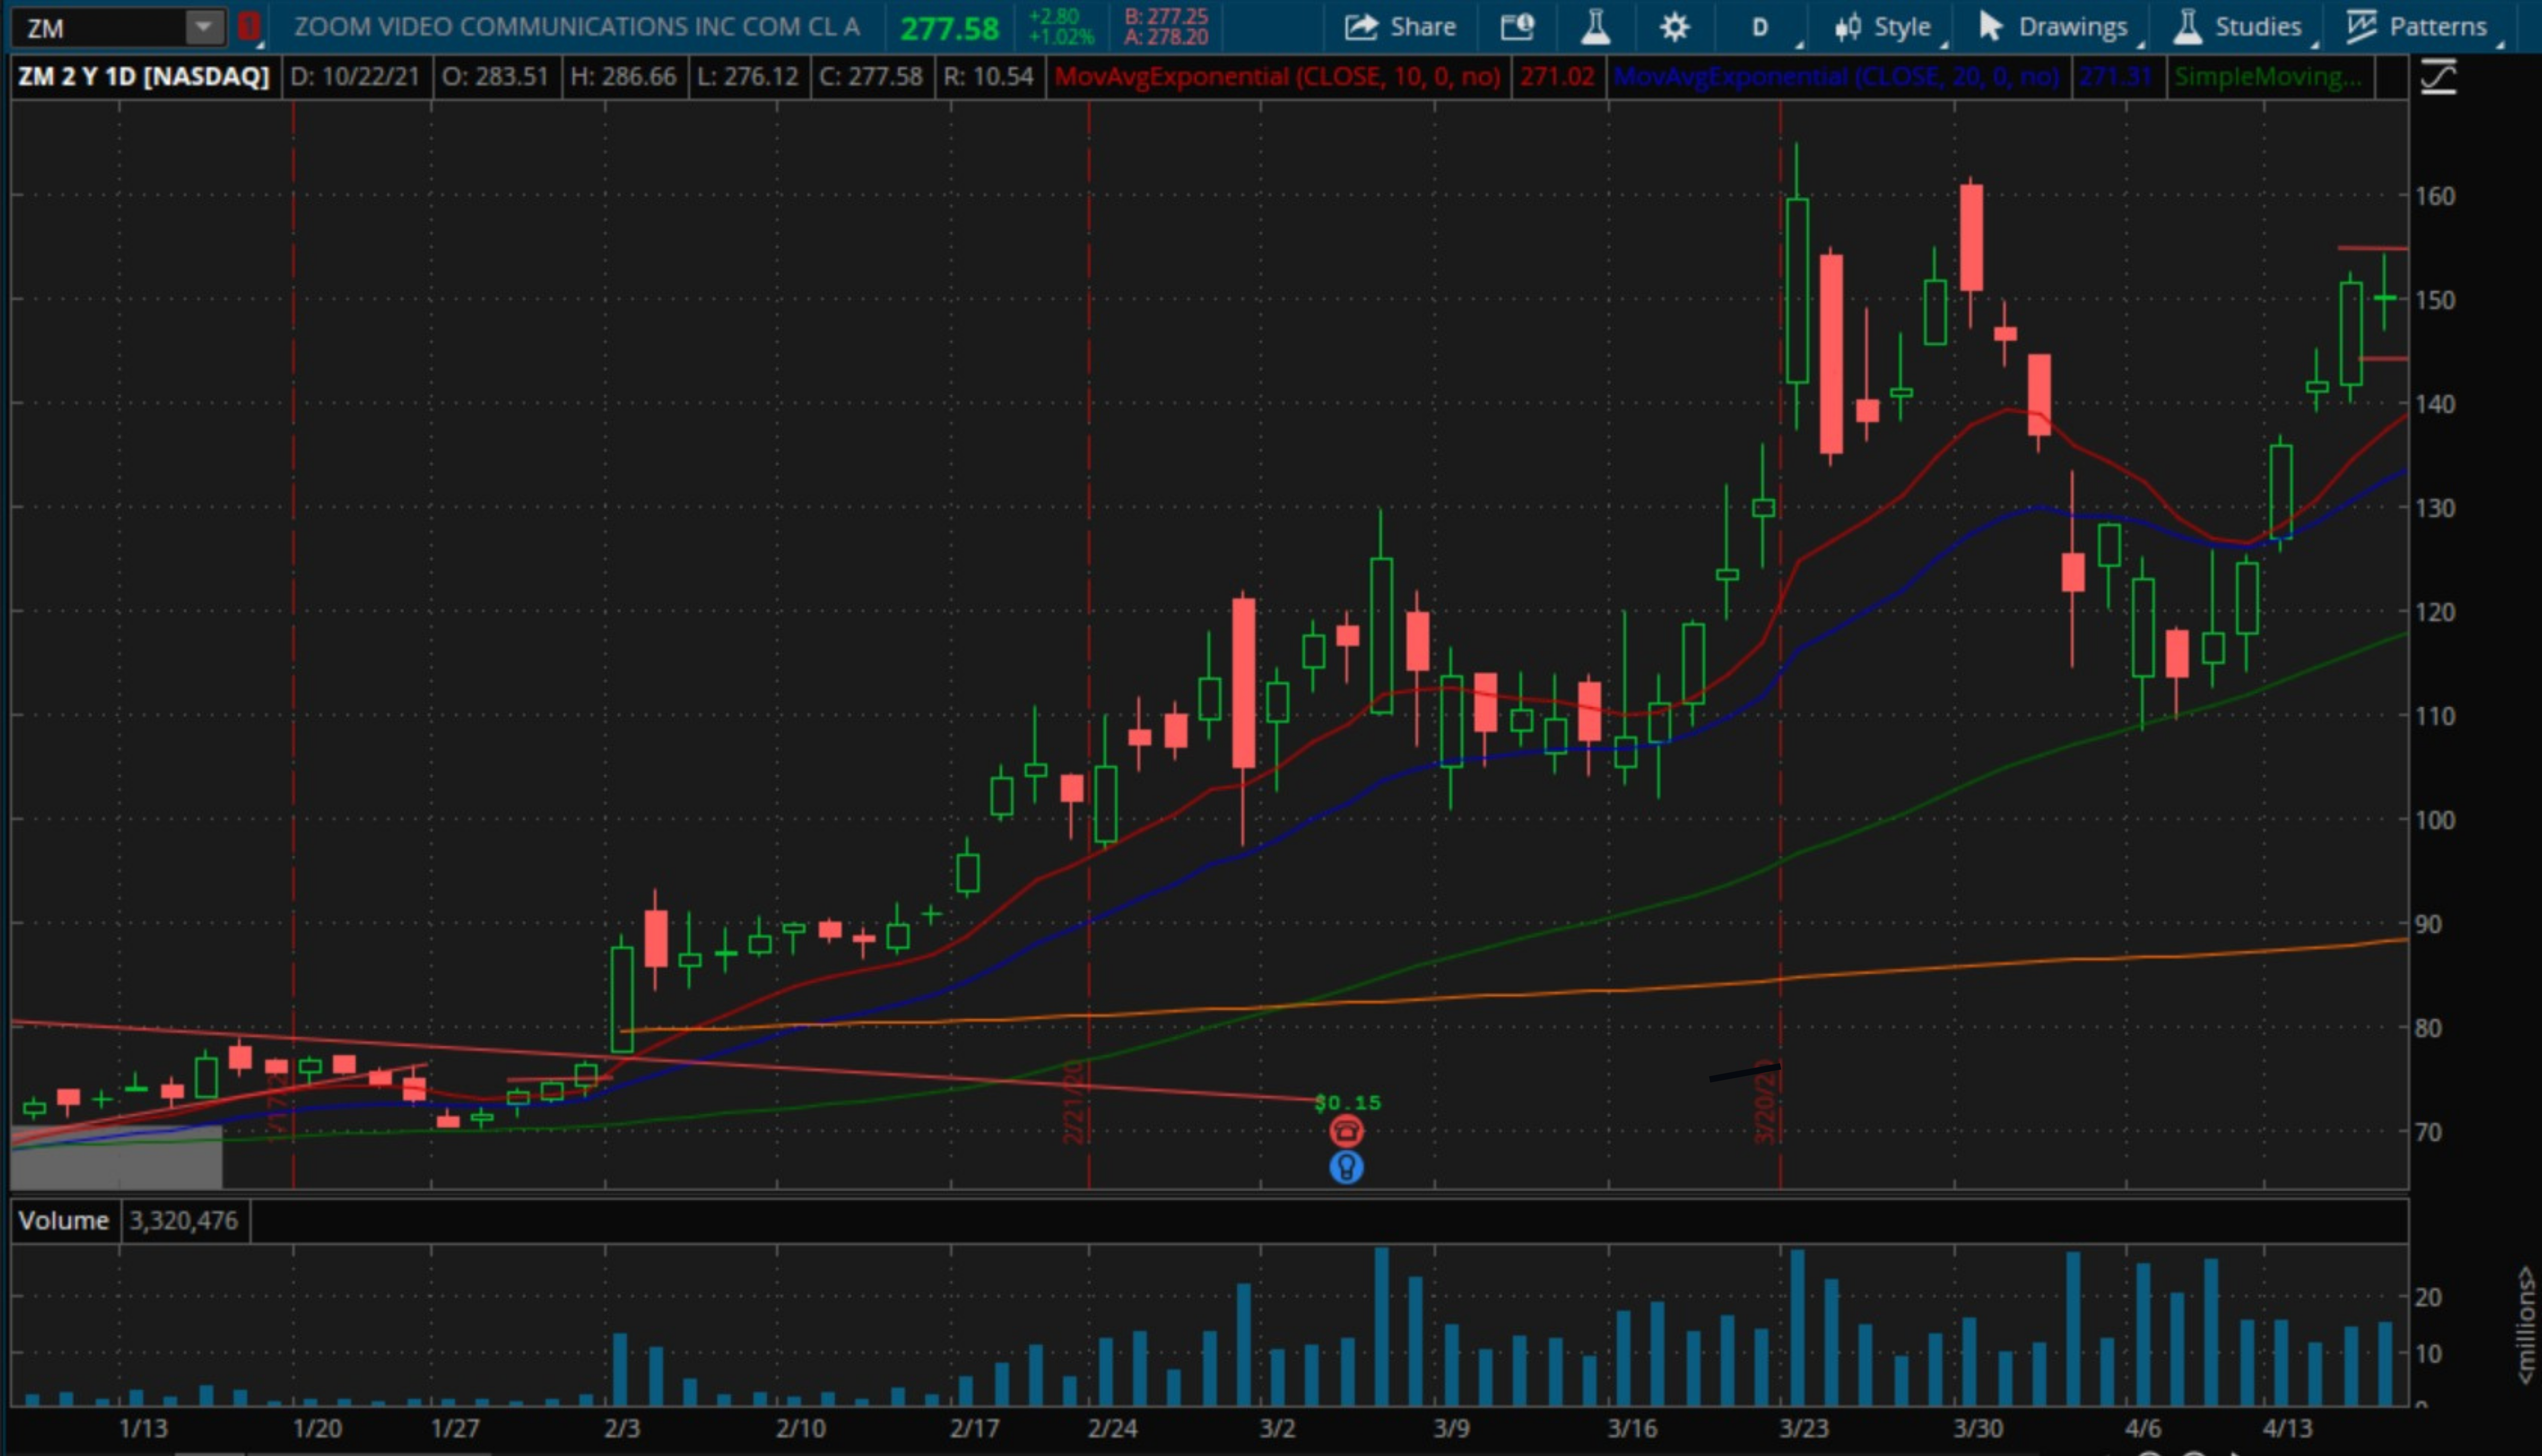
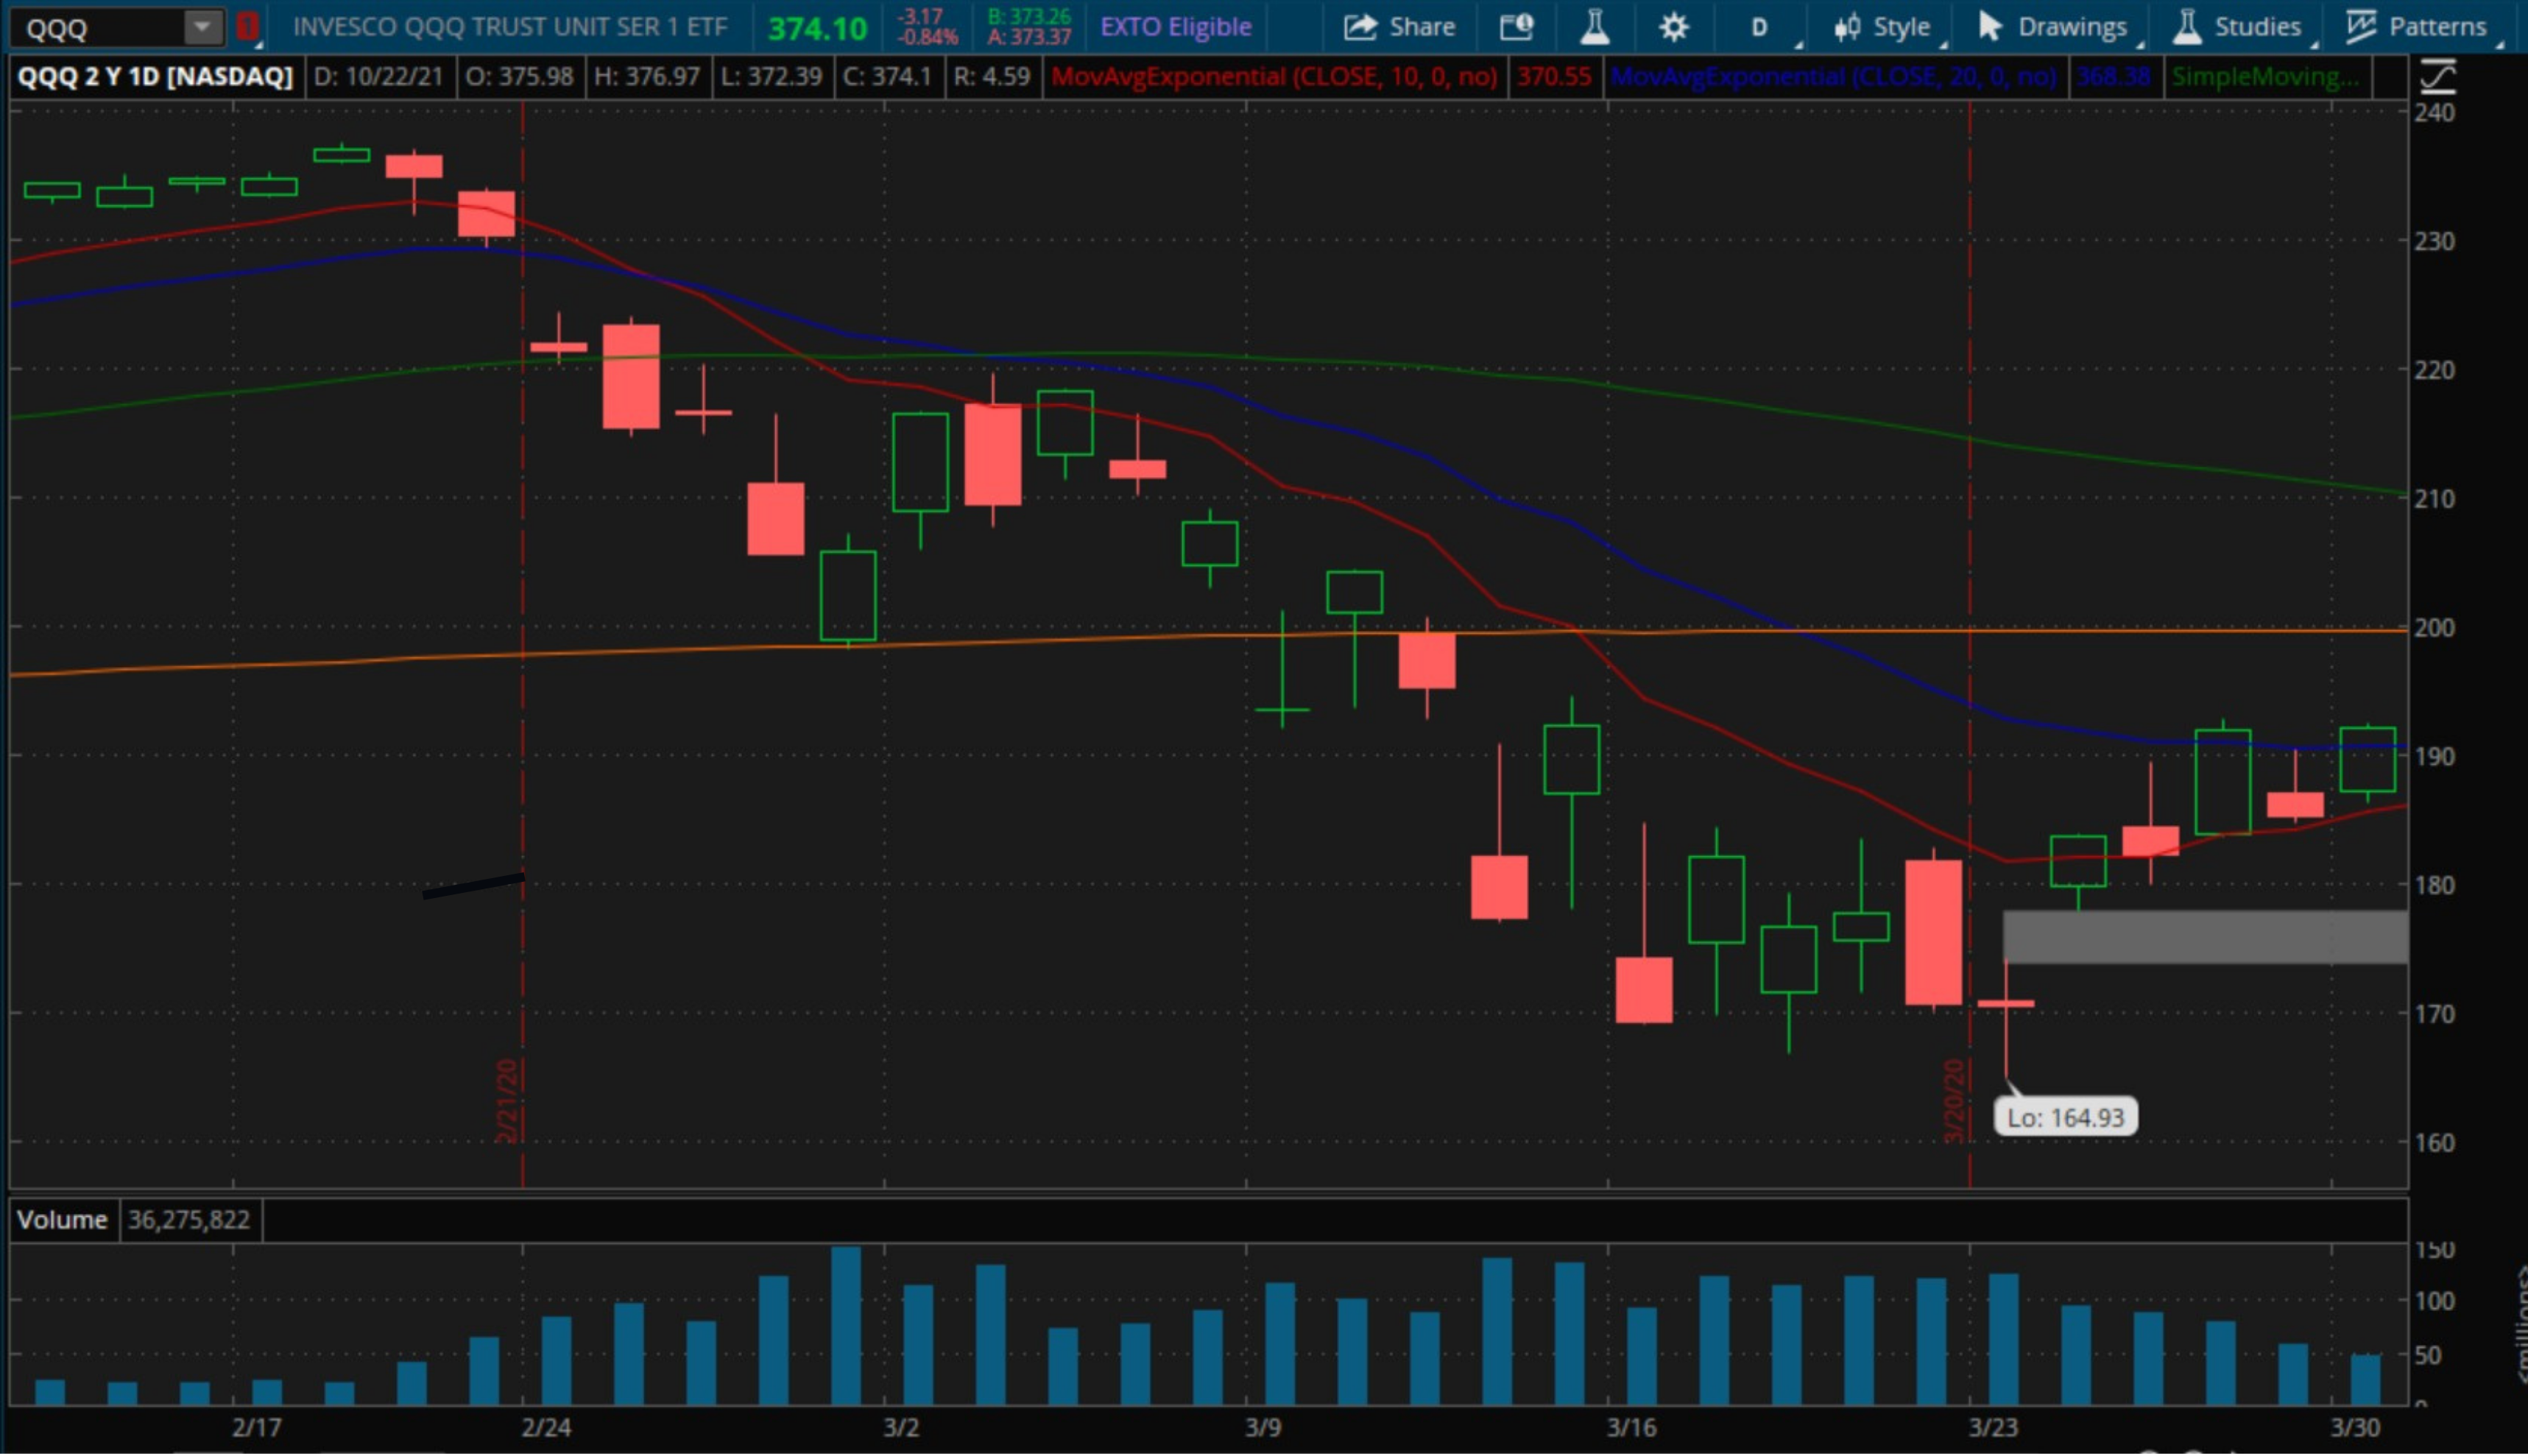
- Example: In the 2020 market selloff, Zoom (ZM) continued to rise even as the market dropped. This unusual strength foreshadowed Zoom’s massive growth as the stock doubled and then quadrupled in value once the market recovered.

Scanning for Relative Strength
- Scan Setup for Relative Strength When setting up scans for relative strength:
- Use a minimum price threshold, such as $20, to focus on stocks that institutions are more likely to trade
- Run these scans on red days when indexes are down 1% or more
- Look for stocks up by at least 2% without any apparent news
- Key Tools for Scanning:
- Finviz: A free tool that allows you to create and save scans for stocks based on performance, volume, and other criteria
- MarketSmith: A premium tool that provides deeper insights and a Growth 250 list that’s great for identifying growth stocks with relative strength
- Trading Software: Most trading software includes basic scanning functions you can use to spot strength

Spotting Patterns of Strength in Intraday Trading
- Intraday Scanning for Strength During trading hours, watch for stocks that resist following the market’s downtrend:
- Look for stocks that make higher lows while the index makes new lows
- These “positive divergences” indicate resilience, suggesting institutional buying
- Pattern to Watch: A “wedge pop” pattern, where a stock breaks out from a wedge shape on its chart, signals a breakout, especially when paired with higher-than-average volume

Understanding Market Cap and Stock Liquidity
- Focus on Liquid, Institutional Names Higher-market-cap stocks tend to be more liquid, meaning institutional players can invest large sums with minimal price impact. Stocks between $2 billion and $25 billion in market cap are often the sweet spot for institutional attention.
- Examples of Institutional Leaders: Companies like Tesla (TSLA) and Nvidia (NVDA) are examples of stocks with high market caps that institutions continue to support. Stocks in the $20 to $50 range often grow substantially with institutional backing.
Building Your Watchlist for High-Strength Stocks
- Lists to Maintain
- Top Dogs: Your highest-conviction stocks showing relative strength
- Daily and Weekly Lists: Review these lists each day to monitor setup potential
- Weekend Routine: Spend time over the weekend reviewing broader lists, like the Russell 3000 or Growth 250, to select candidates for next week’s focus
- Routine is Key: Regularly update and refine your lists based on stock performance in down markets
Conclusion
Identifying stocks with relative strength during market downturns is a powerful way to uncover hidden opportunities. By running targeted scans, observing patterns, and keeping updated watchlists, you’re well-equipped to identify stocks with the potential to outperform once the market recovers. Practice running scans on down days, track your list of strong stocks, and, over time, this process will become an essential part of your trading strategy.
Action Items
- Set Up Scans: Use your trading platform to create a scan for stocks that are up on down days. Adjust filters to screen for stocks above $20 with significant volume.
- Identify Top Performers: Track a few stocks from your scans over time. Notice if they continue to display relative strength over multiple red days.
- Analyze Chart Patterns: Look for the wedge pop pattern or higher lows as indicators of entry points once the market stabilizes.
- Refine Your Lists: Start building a list of stocks that consistently demonstrate strength and review them regularly to identify potential entries.
