EMA Crossback (Downside)
Master the powerful signal that confirms downtrends and learn how to manage risk or profit from declining markets
The EMA Crossback to the Downside is a powerful signal within the Cycle of Price Action that confirms a stock’s downtrend after a Wedge Drop. As the price retests declining moving averages and fails to break through, it sets up opportunities for traders to short stocks or stay in cash during confirmed downtrends. In this lesson, you’ll learn how to recognize the EMA Crossback to the downside, manage risk in volatile downtrends, and use this signal to navigate bear market conditions.
Learning Objectives
By the end of this lesson, you will be able to:
- Identify the EMA Crossback to the downside as a confirmation of a downtrend
- Recognize key signals that precede and follow the EMA Crossback in downtrends
- Use the EMA Crossback to manage risk or short stocks during confirmed downtrends
- Apply the EMA Crossback strategy to major indices and broader market conditions
- Understand the risks associated with shorting and apply best practices during bear markets
What is the EMA Crossback (Downside)?

Defining the EMA Crossback to the Downside
The EMA Crossback to the Downside is the first time a stock retests its declining 10- and 20-day exponential moving averages (EMAs) after a Wedge Drop has confirmed the start of a downtrend. During this retest, the moving averages act as resistance, preventing the price from rising higher, which further confirms the downward momentum.
- Retest of Moving Averages: After the Wedge Drop, the price temporarily rallies into the declining EMAs before continuing lower.
- Confirmation of a Downtrend: The failure to reclaim the moving averages confirms that the stock is likely to continue its downward movement.
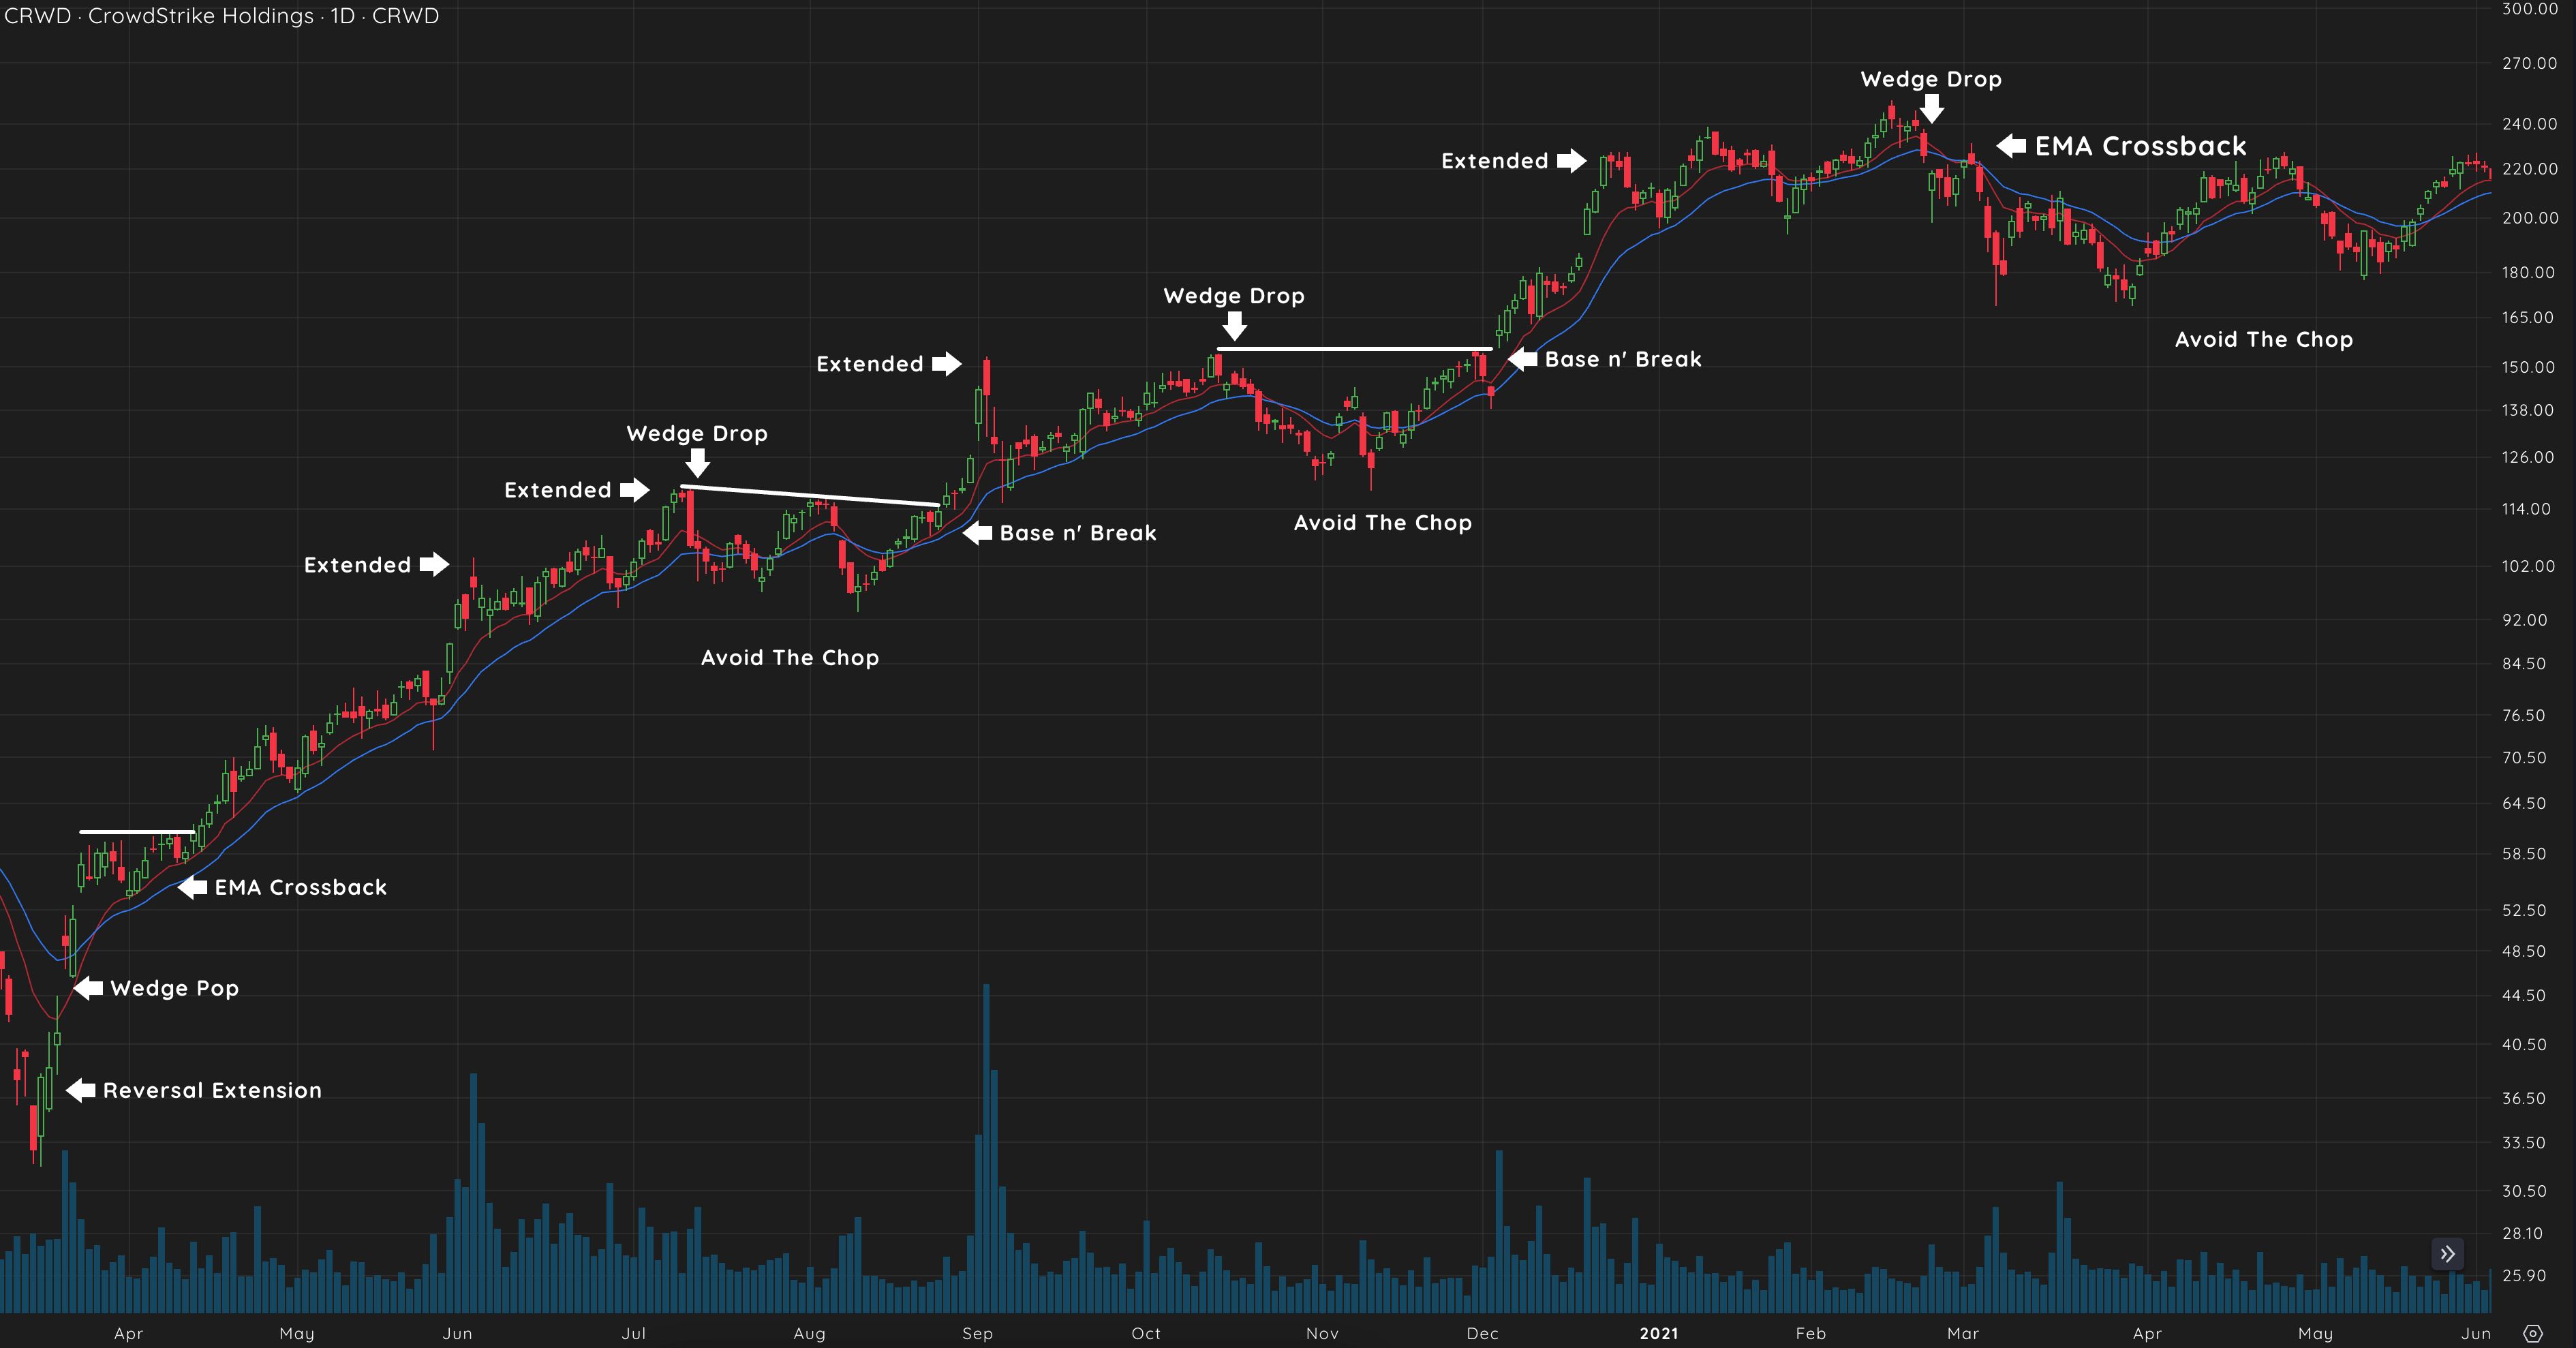
CRWD 2021 Example
In 2021, CRWD experienced an EMA Crossback to the downside after a Wedge Drop, confirming the stock’s move into a downtrend.

Key Characteristics of the EMA Crossback (Downside)
- Declining Moving Averages: The 10-day EMA crosses below the 20-day EMA, and the price remains under both.
- Temporary Rally: The stock rallies briefly but fails to break above the moving averages, leading to a further decline.
- Increased Selling Pressure: Selling pressure typically resumes after the retest, pushing the stock lower as sellers step back in.
Recognizing the EMA Crossback to the Downside
Key Signals Leading to the EMA Crossback
To recognize an EMA Crossback to the downside, focus on the following signals:
- Wedge Drop Confirmation: The Wedge Drop confirms that the uptrend has ended and the downtrend is in place.
- Rally into the Moving Averages: After the initial Wedge Drop, the stock will rally into the declining moving averages. This is where the EMA Crossback occurs.
- Price Resistance at EMAs: The stock struggles to break through the 10- and 20-day EMAs, signaling that the rally is losing momentum.
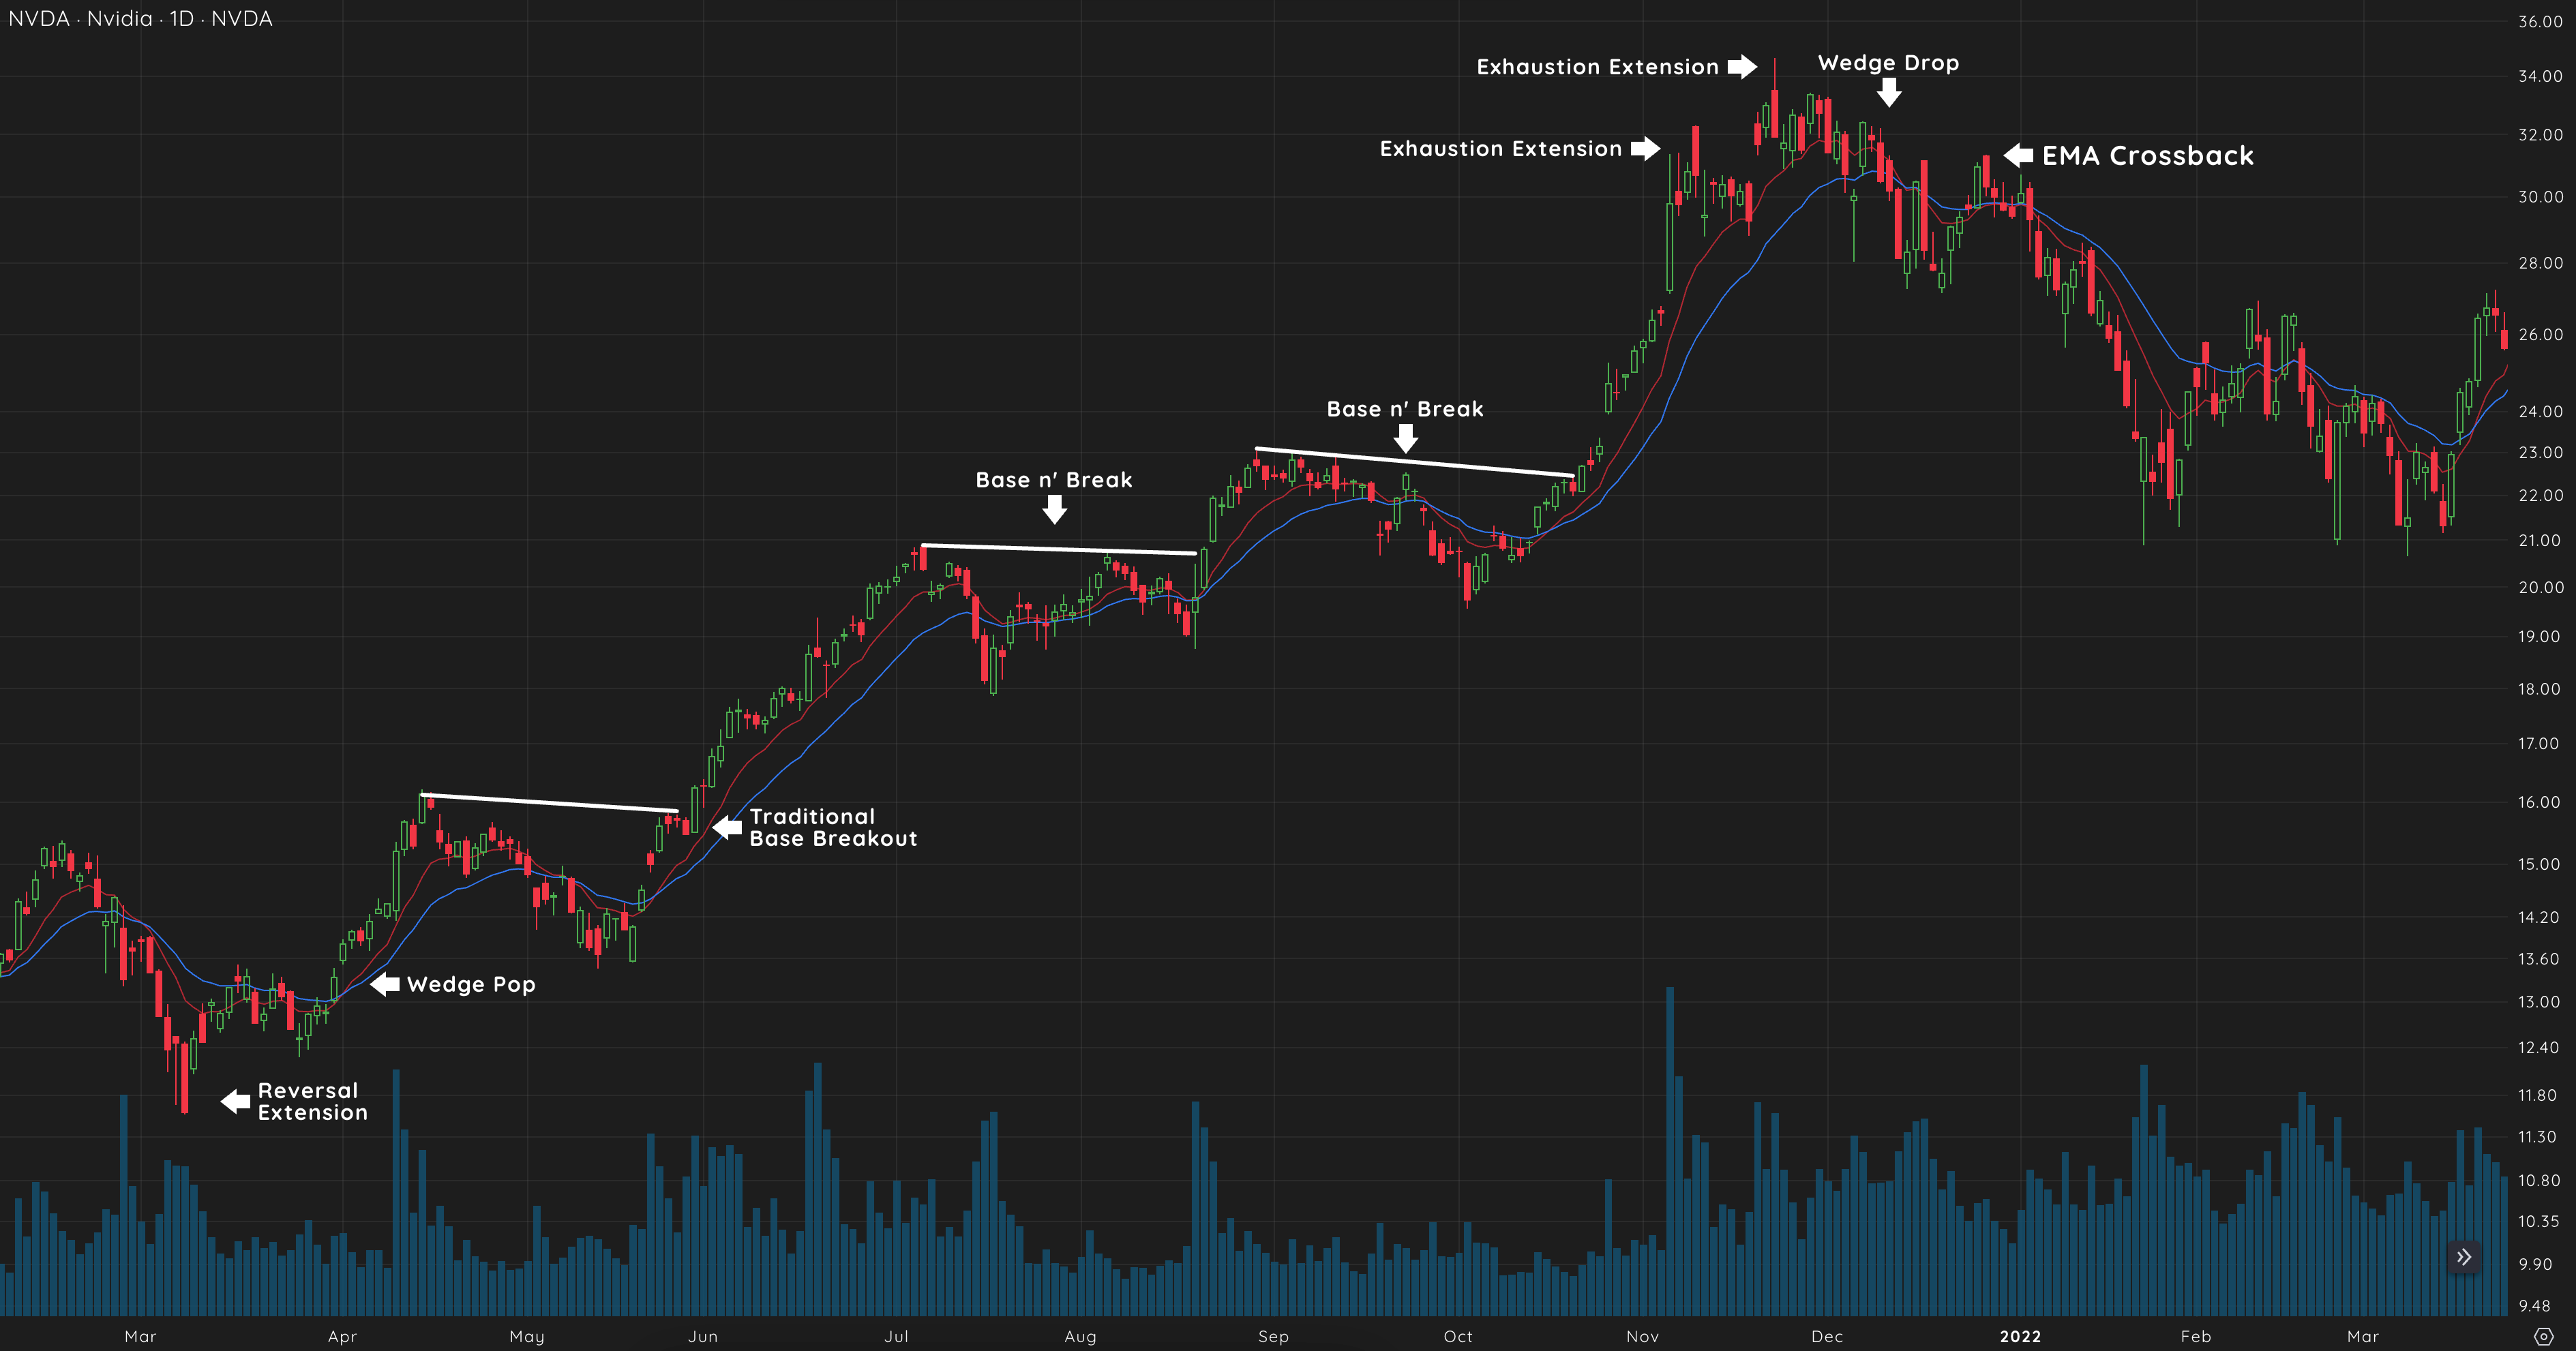
NVDA 2021 Example
NVDA in 2021 experienced a strong rally, but after the Wedge Drop, the stock retested its moving averages, confirming further downside at the EMA Crossback.

Volatility of Downtrends
Downtrends tend to be more volatile than uptrends. Price movements are faster, and sharp rallies (known as “bear market rallies”) can occur before the stock continues lower. Be patient and wait for the stock to show weakness at the moving averages before taking action.
Trading the EMA Crossback to the Downside
Shorting the EMA Crossback
The EMA Crossback provides a low-risk entry for short positions when the stock rallies into its declining moving averages:
- Short at the Pivot: Enter a short position once the stock shows resistance at the moving averages and begins to roll over. The pivot point occurs when the price moves through the moving averages but fails to break above them.
- Set a Stop Above the High: Place your stop-loss just above the high of the current rally to manage risk in case the stock reverses.
- Wait for Confirmation: Avoid shorting the stock immediately as it rallies into the moving averages. Instead, wait for signs of weakness, such as a failed breakout or increased selling pressure.
Tip: Be cautious not to short too late in the downtrend, as the stock may already be nearing a bottom or preparing for a reversal. Use the Cycle of Price to assess how far along the stock is in its current trend.
Managing Risk in a Downtrend
Downtrends are inherently more volatile, so managing risk is critical:
- Avoid Shorting in Strong Bull Markets: Shorting should be limited to confirmed downtrends, especially in bear markets or weaker stocks. In strong bull markets, shorting can be dangerous as stocks often recover quickly.
- Tight Stop Placement: Use tight stops above the moving averages to protect against sharp rallies or reversals.
- Watch for Support Levels: As the stock trends lower, be mindful of potential support levels where the stock might pause or reverse.
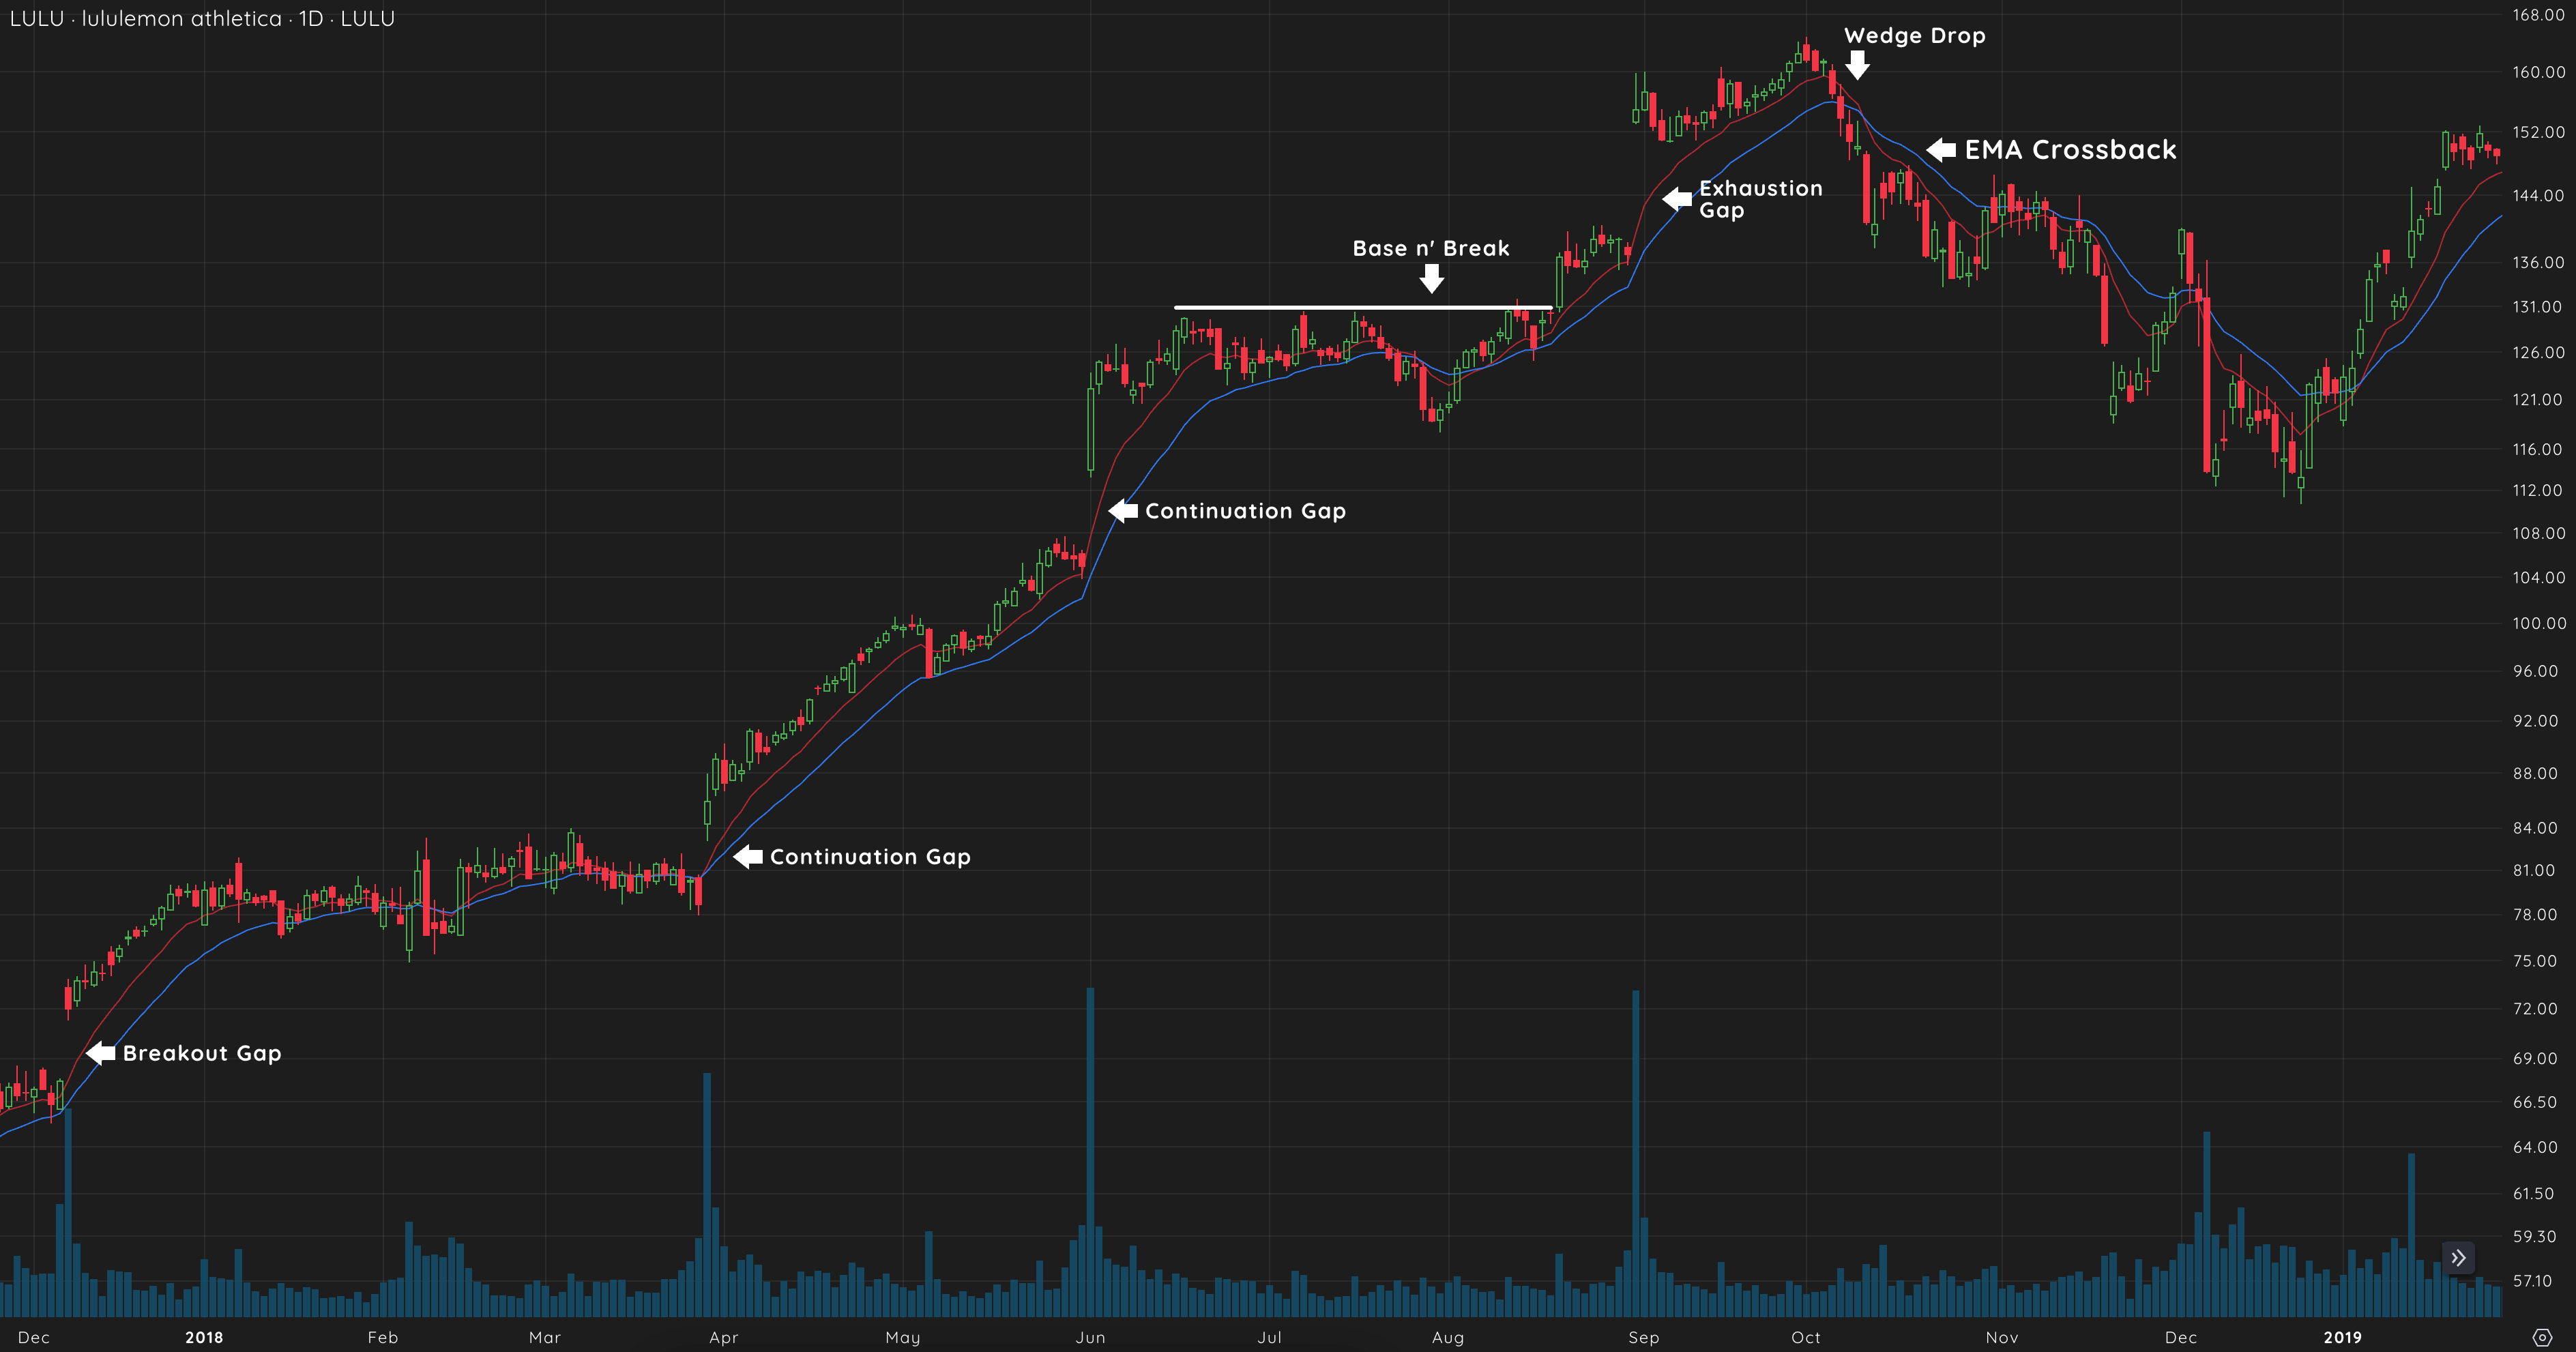
LULU 2018 Example
LULU in 2018 experienced an EMA Crossback to the downside after an Exhaustion Extension and Wedge Drop. The stock rallied briefly into its moving averages, providing a low-risk opportunity to short as it continued lower.

Applying the EMA Crossback to Indices and Market Conditions
Leading Stocks vs. Market Indices
Just as leading stocks often begin their Cycle of Price ahead of the broader market, they can also show signs of weakness earlier. Use the EMA Crossback to assess whether leading stocks are struggling against their moving averages, which can indicate that the broader market may follow suit.
- Monitor Leading Stocks: If you notice multiple leading stocks forming EMA Crossbacks to the downside, it’s a strong signal that market conditions are deteriorating.
- Wedge Drops on Indices: If a major market index like the S&P 500 or NASDAQ forms a Wedge Drop followed by an EMA Crossback to the downside, it confirms that the market is entering a downtrend.
SHOP 2019 Example
In 2021, SHOP formed a Wedge Drop followed by an EMA Crossback to the downside after a significant run-up. As the stock struggled to reclaim its moving averages, it signaled further downside, mirroring broader market conditions.

Staying in Cash or Shorting the Market
In confirmed downtrends, it’s often best to stay in cash and wait for the market to reset. However, for experienced traders, the EMA Crossback provides an opportunity to short the market:
- Shorting the Index: Short major indices using ETFs or options when you notice an EMA Crossback confirming the downtrend.
- Stay Defensive: If you’re not comfortable shorting, staying in cash allows you to avoid the volatility and watch for opportunities when the market stabilizes.
Tip: Use the EMA Crossback on indices as a broader market signal. When the indices confirm a downtrend, reduce exposure to individual stocks and focus on screening for stocks that show relative strength during market corrections.
Key Takeaways
- The EMA Crossback to the downside is the first retest of declining moving averages after a Wedge Drop, confirming the downtrend
- Key characteristics include declining moving averages, temporary rallies that fail at resistance, and increased selling pressure
- Downtrends are more volatile than uptrends, requiring patience and careful risk management
- The EMA Crossback provides low-risk entry opportunities for short positions when stocks show weakness at moving averages
- Monitor leading stocks for EMA Crossbacks as early warning signals for broader market weakness
- Use tight stops above moving averages to protect against sharp reversals in volatile downtrends
Reflection
Think about how you can apply the cycle of price action to your current trades. Where do you need to improve your timing or stock selection? Consider how recognizing EMA Crossbacks earlier could help you avoid losses or identify profitable shorting opportunities.
Conclusion
The EMA Crossback to the Downside is a critical confirmation signal that helps traders identify and navigate downtrends with greater confidence. By understanding this pattern within the broader Cycle of Price Action, you can make more informed decisions about when to stay in cash, when to short, and how to manage risk during volatile market conditions.
Developing a trading system involves selecting the right stocks, timing your entries and exits with the cycle of price action, and managing risk. By understanding these cycles, using moving averages, and incorporating multiple time frames, you’ll be better equipped to make informed trading decisions. Stay patient in the early stages of a stock’s cycle and become more defensive as it approaches exhaustion. With these tools, you’ll minimize losses and maximize profits as you navigate the stock market.
