The Reversal Extension
Master the art of identifying market psychology shifts and positioning for trend reversals with this powerful trading setup
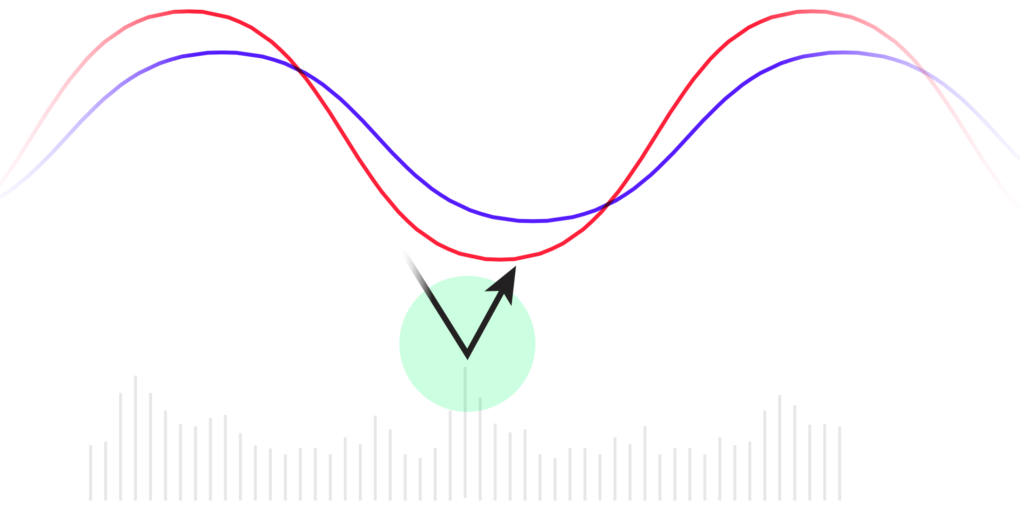
A Reversal Extension occurs when a stock, previously in a downtrend, pulls away from the 10-day moving average, capitulates at a low, and then snaps back up, often with a surge in volume. This pattern indicates that fear has caused traders to exit their positions, but now, with sellers fading and buyers stepping in, a price reversal is likely to take shape.
Learning Objectives
By the end of this lesson, you will be able to:
- Recognize a Reversal Extension as a signal that a stock or market is bottoming
- Analyze how volume and moving averages confirm a trend reversal
- Use multiple time frames to identify support and confirm a Reversal Extension
- Screen for strong stocks during downtrends that are poised to lead in the next market cycle
- Apply effective risk management strategies when trading volatile Reversal Extensions
What is a Reversal Extension?

Defining the Reversal Extension
A Reversal Extension occurs when a stock, previously in a downtrend, pulls away from the 10-day moving average, capitulates at a low, and then snaps back up, often with a surge in volume. This pattern indicates that fear has caused traders to exit their positions, but now, with sellers fading and buyers stepping in, a price reversal is likely to take shape.
Key Indicators
- Volume Spike: Heavy selling volume shows capitulation. This fear-driven selling eventually subsides, signaling the end of the downtrend.
- Price Rebounds: The stock or index bounces back towards the moving averages, supported by newfound buyer interest.
Example: A stock trending downward finally bottoms with a sharp increase in volume and a price bounce back into the moving averages, signaling a potential Reversal Extension.
Trading the Reversal Extension
ELF – 2023

ELF demonstrated a textbook Reversal Extension in 2023, showing the characteristic volume spike and price rebound after capitulation.
WING – 2023

WING’s 2023 pattern shows how Reversal Extensions can occur with strong volume confirmation and sustained momentum.
Using Time Frames for Confirmation
When a Reversal Extension forms, traders need to consult higher time frames to confirm major support levels. For example:
Daily Reversal on a Weekly Downtrend: If the price extends away from the moving averages on a daily chart, look to the weekly chart for a potential area of support.
Intraday Extensions: If you’re trading on a 15-minute or hourly chart, confirm support on the daily chart.
Risk Management
Reversal Extensions are often volatile, meaning large price swings can occur within a short period. When trading this setup:
Risk Management Guidelines
- Position Sizing: Keep your position sizes smaller to manage risk during these volatile periods.
- Stop Placement: Set your stops just below the low of the Reversal Extension bar. This helps protect your capital in case the reversal fails.
Trading or Waiting?
While the Reversal Extension is a strong signal, it’s not always the best setup for every trader. Sometimes it’s wiser to wait for further confirmation, such as the Wedge Pop or Base n’ Break, before adding exposure. These setups offer tighter stops and clearer pivot points as the price consolidates.
Applying the Reversal Extension in a Market Downtrend
CRWD – 2023 Market Context

CRWD in 2023 maintained its relative strength during a market decline, making it a leading candidate for a future rally once the market reversed.
Identifying Strong Stocks
During a market downtrend, the Reversal Extension on the index often signals that individual stocks may soon bottom. This is when you should screen for stocks that are resisting the broader decline and showing relative strength compared to the market.
Waiting for the Market Reversal
When a Reversal Extension forms on a major index, traders should wait for volatility to subside. During this period, stocks showing strength will often form tight basing patterns or consolidations, signaling readiness for a breakout. Once the market stabilizes, these leading stocks will break above pivots and continue into their own price cycles.
Practical Tips for Trading the Reversal Extension
Use Multiple Time Frames
Daily and 65-Minute Charts: Used for managing intermediate trends and setting stops.
15-Minute Charts: Pinpoint precise entry points as price action becomes clearer.
Volume Confirmation
Recognize Leaders Early
Reflection
The next time you see a Reversal Extension forming, consider how you might use it to inform your overall trading strategy. Will you enter immediately or wait for more confirmation?
Conclusion
The Reversal Extension is a powerful signal that the market or individual stocks may be bottoming, but it’s more of a change in mindset than a concrete trade setup. It indicates that sellers have exhausted their positions, and buyers are ready to step in, but the trade itself may be best entered after further confirmation through tighter, more structured setups. By using multiple time frames to identify support, watching volume for signs of capitulation, and screening for strong stocks during downtrends, you’ll be better positioned to capitalize on the next market cycle.
